Introduction
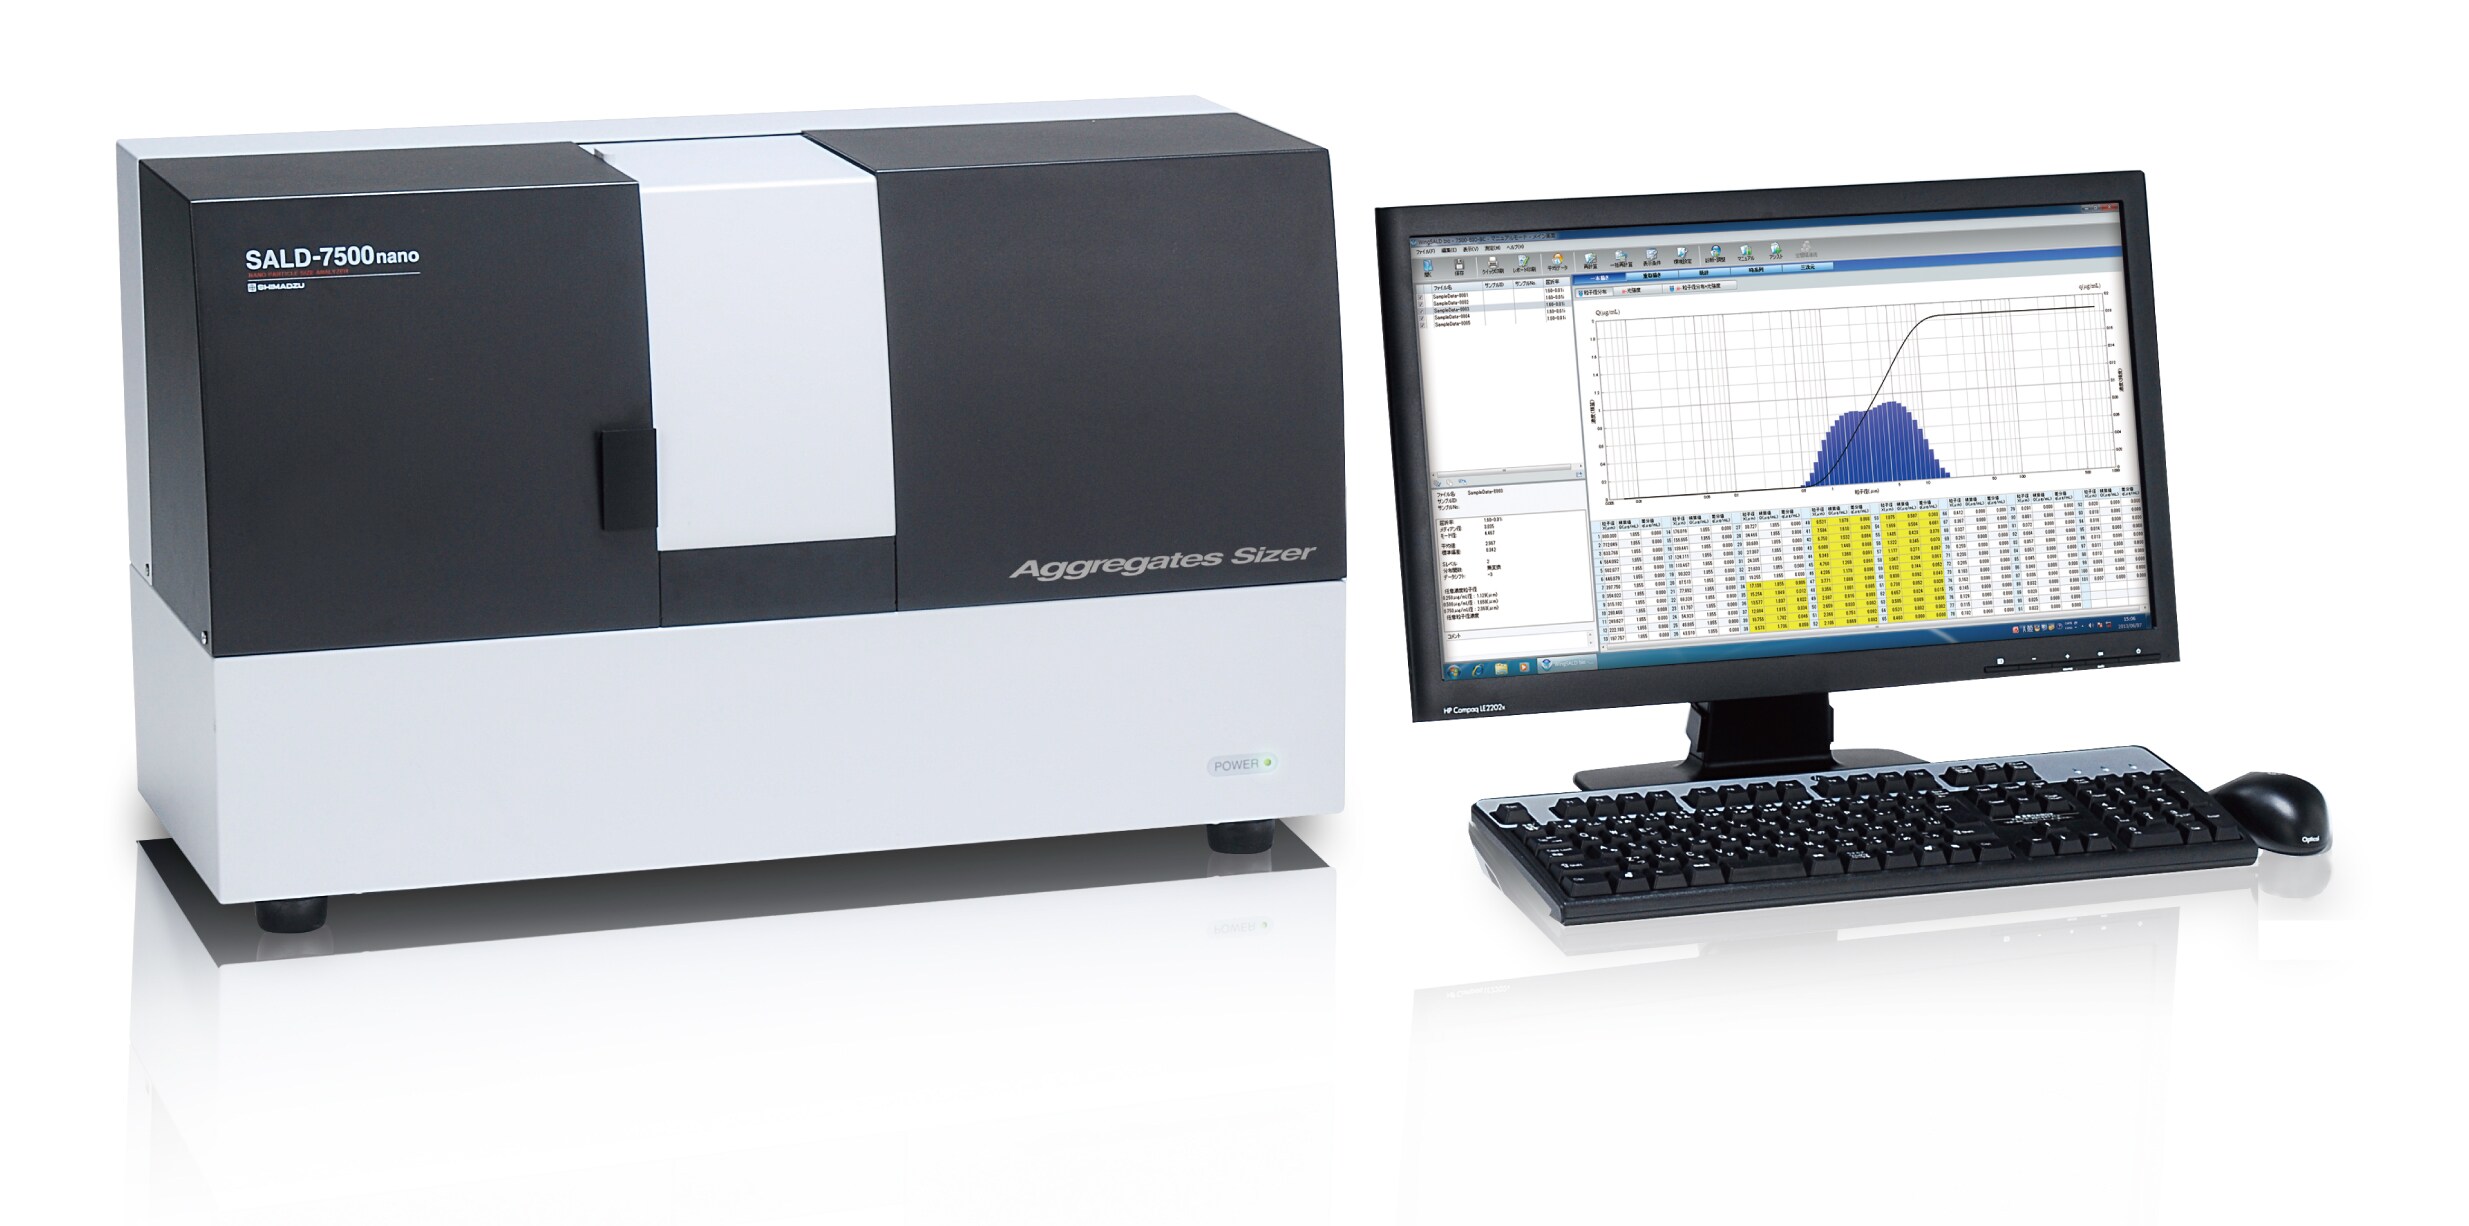
Additives such as antioxidants, ultraviolet absorbers, and flame retardants are added to polymers, namely, plastics and rubber. Because performance and durability can be dramatically enhanced by adding appropriate types and quantities of additives in the development and production of polymer materials, it is extremely important to obtain information on the additives contained in thosematerials. Application News No. C79 introduced an example of quantitative analysis of polymer additives using a triple quadrupole (TQ) type high performance liquid chromatograph mass spectrometer (LC-MS). This Application News introduces an example of qualitative analysis and quantitative analysis of the polymer additives in food containers using the LCMS-9030, which is a quadrupole time-of-flight (QTOF) LC-MS.
Analysis of Food Containers
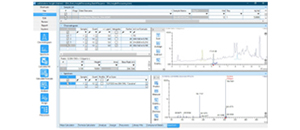
In this experiment, the polymer additives contained in five types of food containers were analyzed. Samples for the analysis were prepared by adding 1 mL of THF to 0.1 g of finely-chopped food container materials (pack, film), conducting sonication for 1 min, adding 1 mL of methanol to the sample, filtering the supernatant with a 0.2 μm filter, and then diluting the sample withmethanol. Fig. 1 shows the result of peak picking of the food A film using the "ANALYZE" function of LabSolutions Insight Explore™.
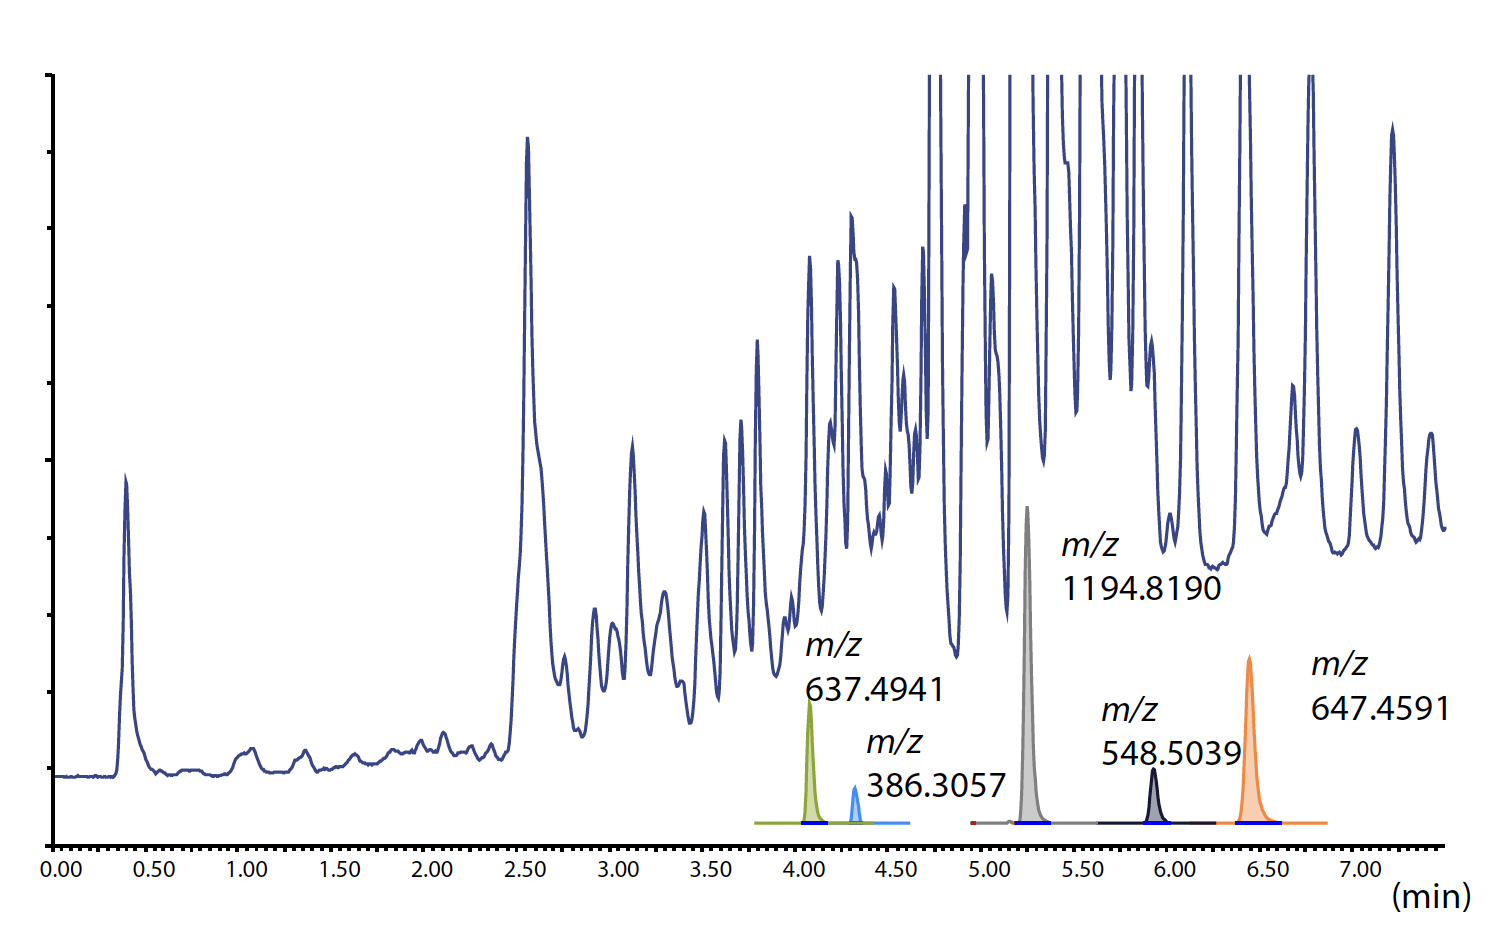
Peaks were detected on the extracted ion chromatogram (EIC) at m/z 637.4941, 386.3057, 1194.8190, 548.5039, and 647.4591. These m/z correspond to the m/z of ions originating from Irganox® 1098, CYANOX® 425, Irganox® 1010, Irganox® 1076, and Irgafos® 168, respectively. As an example, Fig. 2 shows the composition estimation results for the peak (peak X) on the EIC at m/z 637.4941. It was found that the compositional formula is C40H64N2O4.
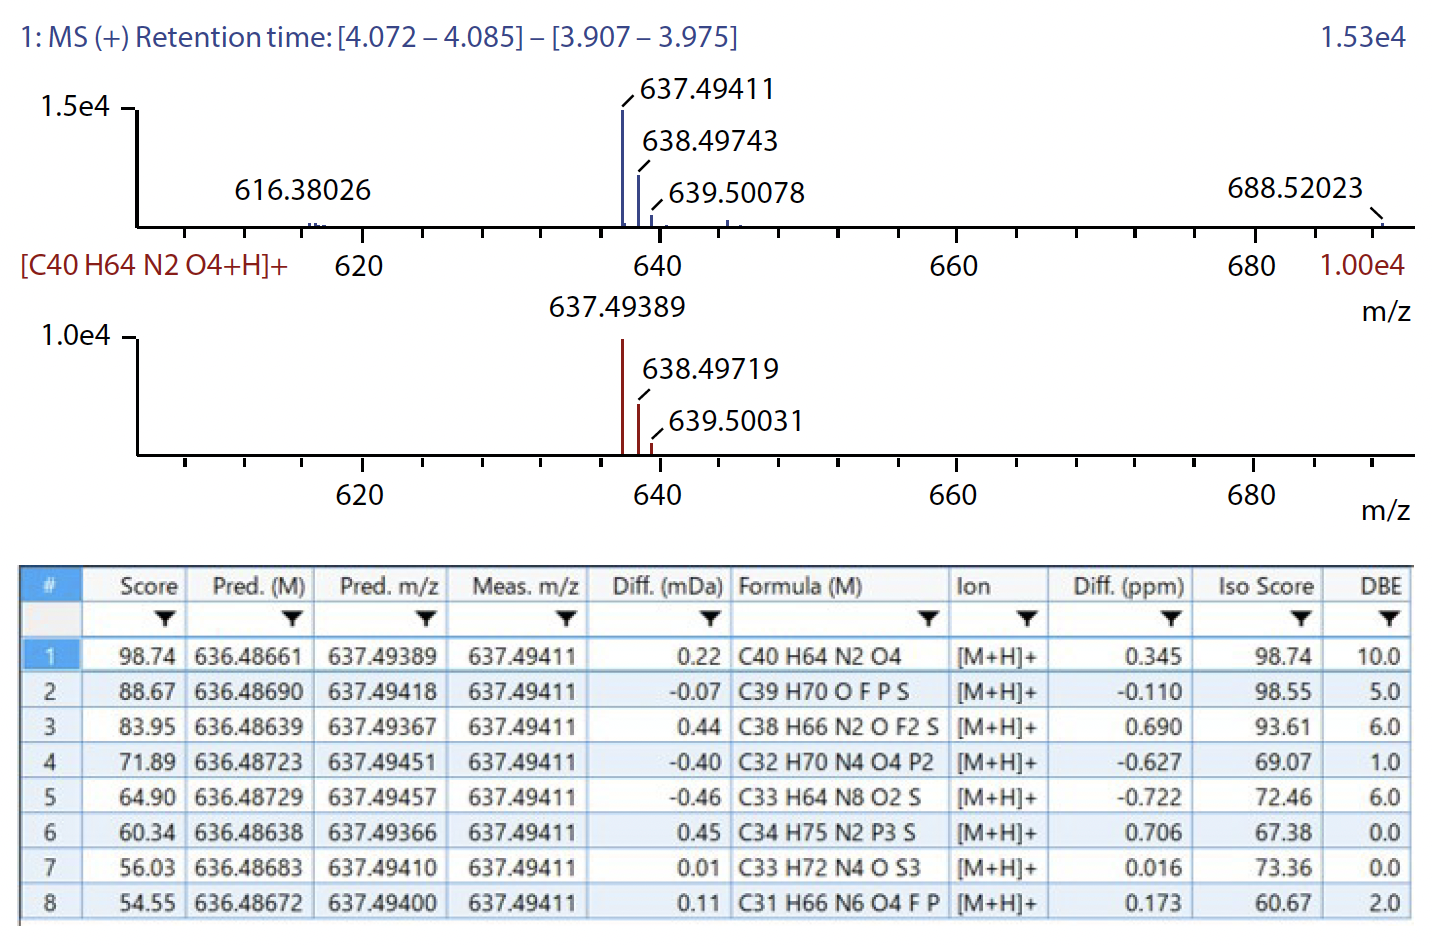
Table 1 Measurement Conditions
HPLC Conditions
Column:Kinetex® 2.6u XB-C18 (75 mm x 2.1 mm I.D., 2.6 μm)
Mobile Phase A: Water containing 10 mmol/L Ammonium formate
Mobile Phase B: Methanol
Flow Rate: 35 % (0 min) – 100 % (4-7.5 min) – 35 % (7.51-10 min)
Column Temperature: 40 ˚C
Injection Volumne: 2 μL
MS Conditions
Ionization:: ESI positive / ESI negative
Mode: Scan, MS/MS
Nebulizing Gas Flow: 2.0 L/min
Drying Gas Flow: 10.0 L/min
Heating Gas Flow: 10.0 L/min
DL Temperature: 250 ˚C
BH Temperature: 400 ˚C
Interface Temperature: 300 ˚C
Compound Search
In addition, an analysis was carried out using ACD/MS Structure ID Suite (Advanced Chemistry Development, Inc., ACD) to confirm the structural formula and compound name of this peak. This software makes it possible to list compounds from the PubChem offline database, which contains approximately 100 million items, based on precise mass and compositional formula information, and assign ranks of compounds from the degree of coincidence (assignment rate) between the product ion obtained by fragment prediction and the product ion observed in the measured MS/MS spectrum.
A database search by the compositional formula C40H64N2O4 found 71 candidate compounds. Fig. 3 shows the result of the ranking of the candidate compounds found in the database search. The compound PubChem CID 90004 showed the highest assignment rate.
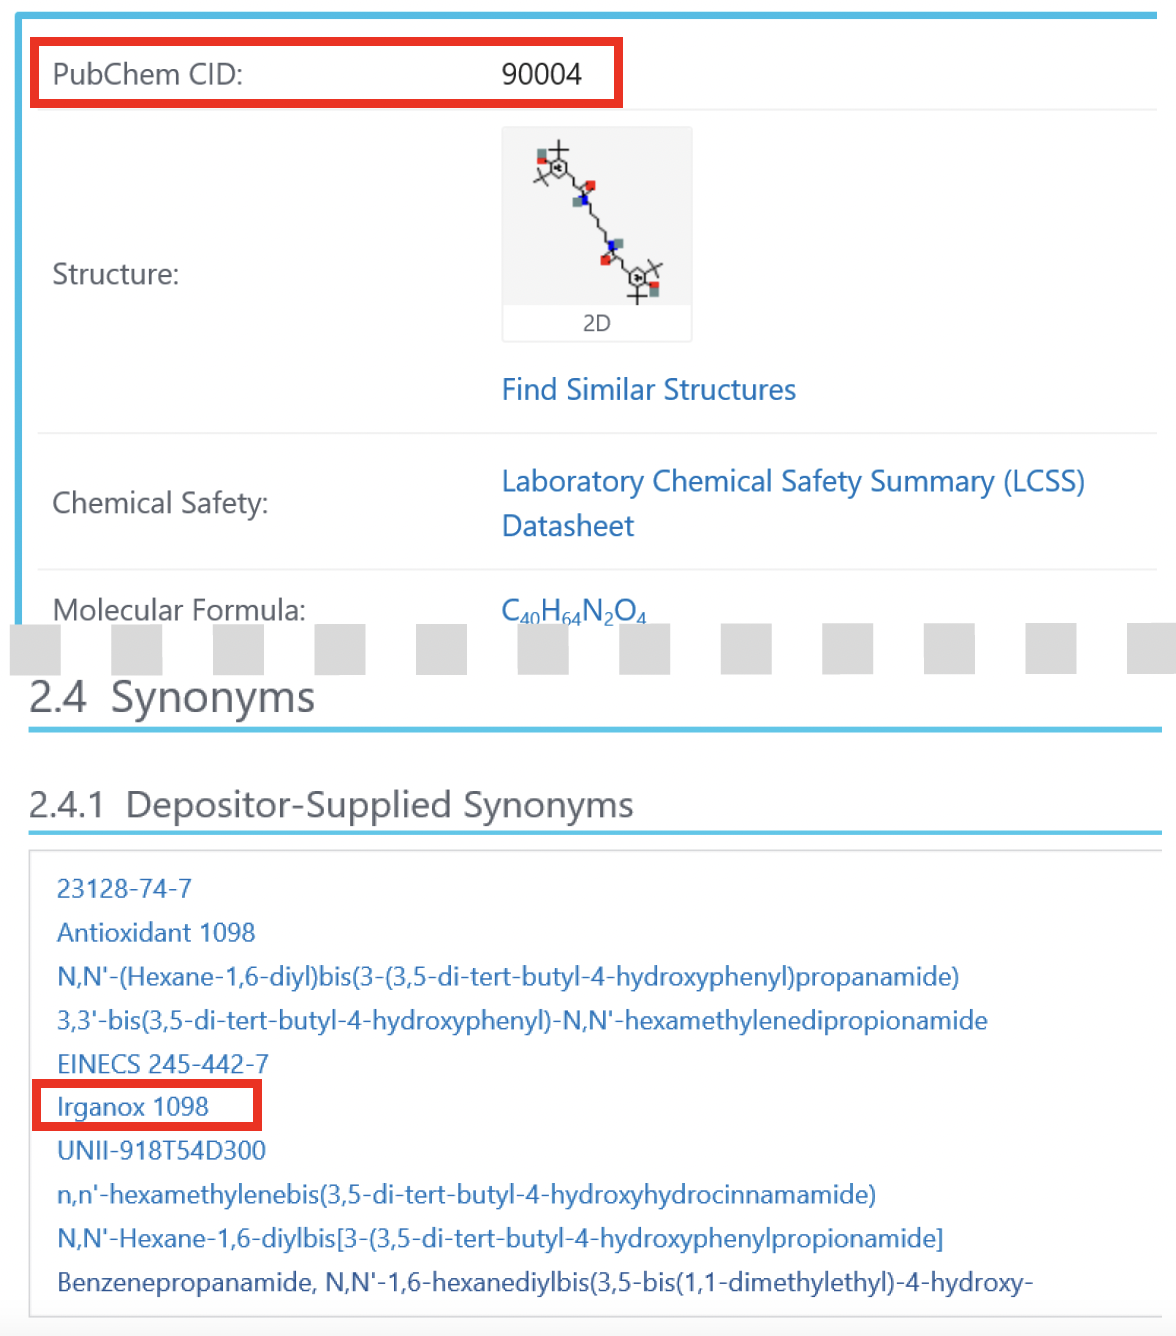
As the result of an online search using PubChem, this compound was identified as Irganox® 1098 (Fig. 4).
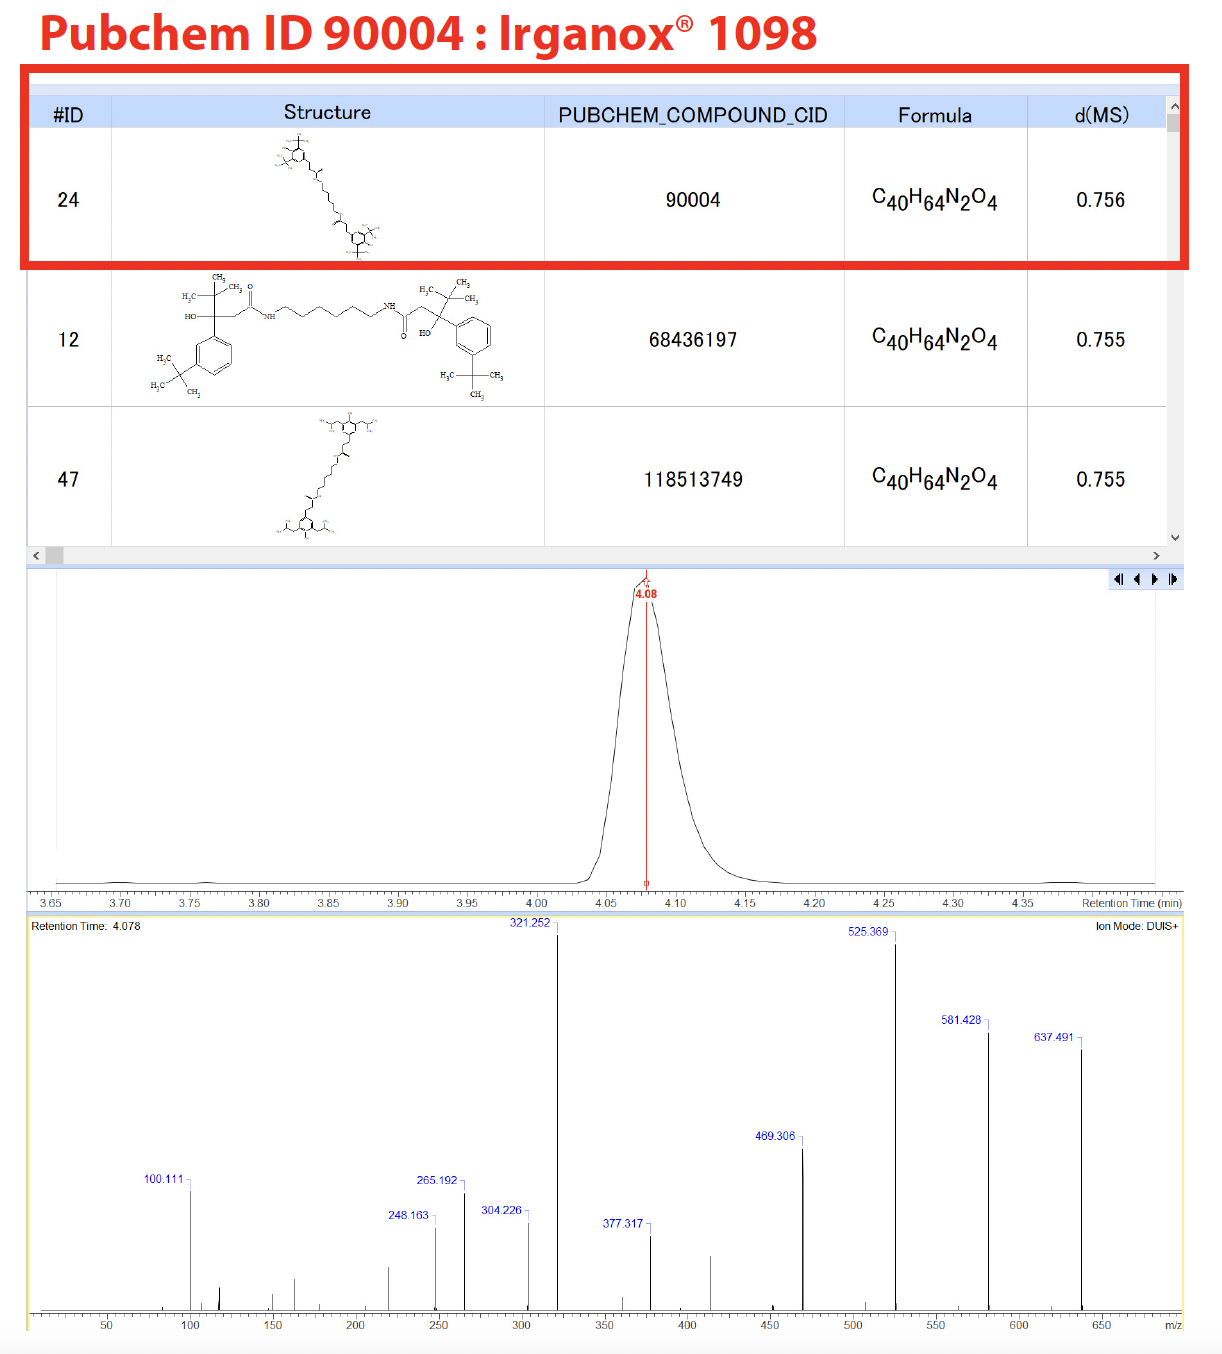
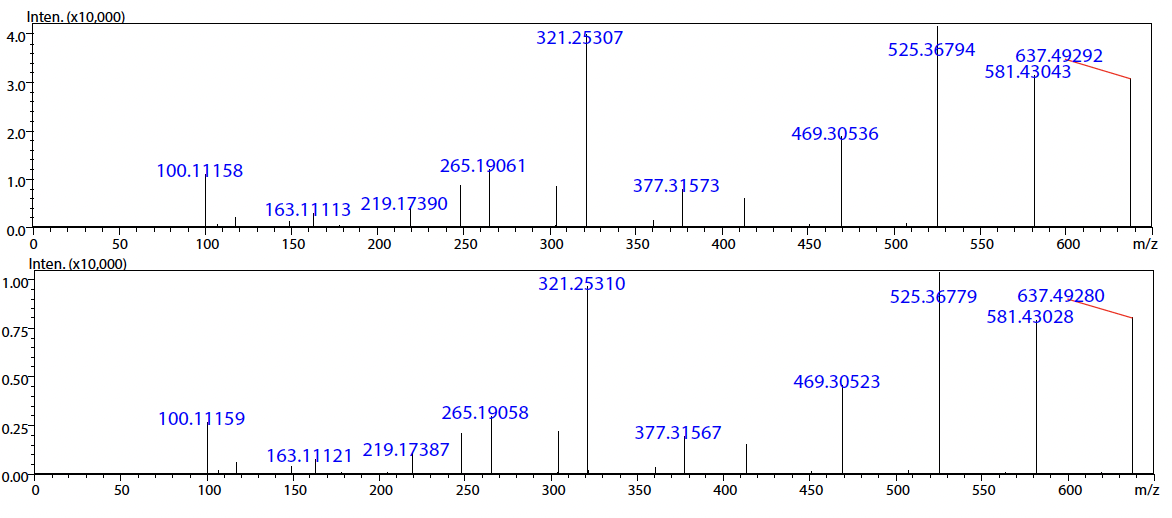
For a sure qualitative analysis, a standard sample of the additive was measured. The result of confirmation of the retention time of the above-mentioned Irganox® 1098 coincided with the retention time of peak X. The MS/MS spectra of Irganox® 1098 and peak X were also compared (Fig. 5). These results confirmed that peak X is Irganox® 1098.
As described above, it is possible to search the structural formula and compound name of target peaks by a process of ① LC-MS and LC-MS/MS measurement, ② peak picking using Insight Explore, ③ composition estimation of the target peak, ④ search for the structural formula using an offline database, ⑤ narrowing of the candidate compounds based on the assignment rates of fragments, ⑥ search for the structural formula and compound name using the online database, and ⑦ confirmation analysis using a standard sample using Shimadzu LCMS-9030 and LabSolutions Insight Explore and ACD/MS Structure ID Suite.
Quantitative Analysis of Polymer Additives in Food Containers
MS/MS chromatograms were acquired for a quantitative analysis of the polymer additives contained in the food containers.
Fig. 6 shows the respective calibration curves, and Table 2 shows the range of the calibration curve and the coefficient of determination (R2) of each compound.
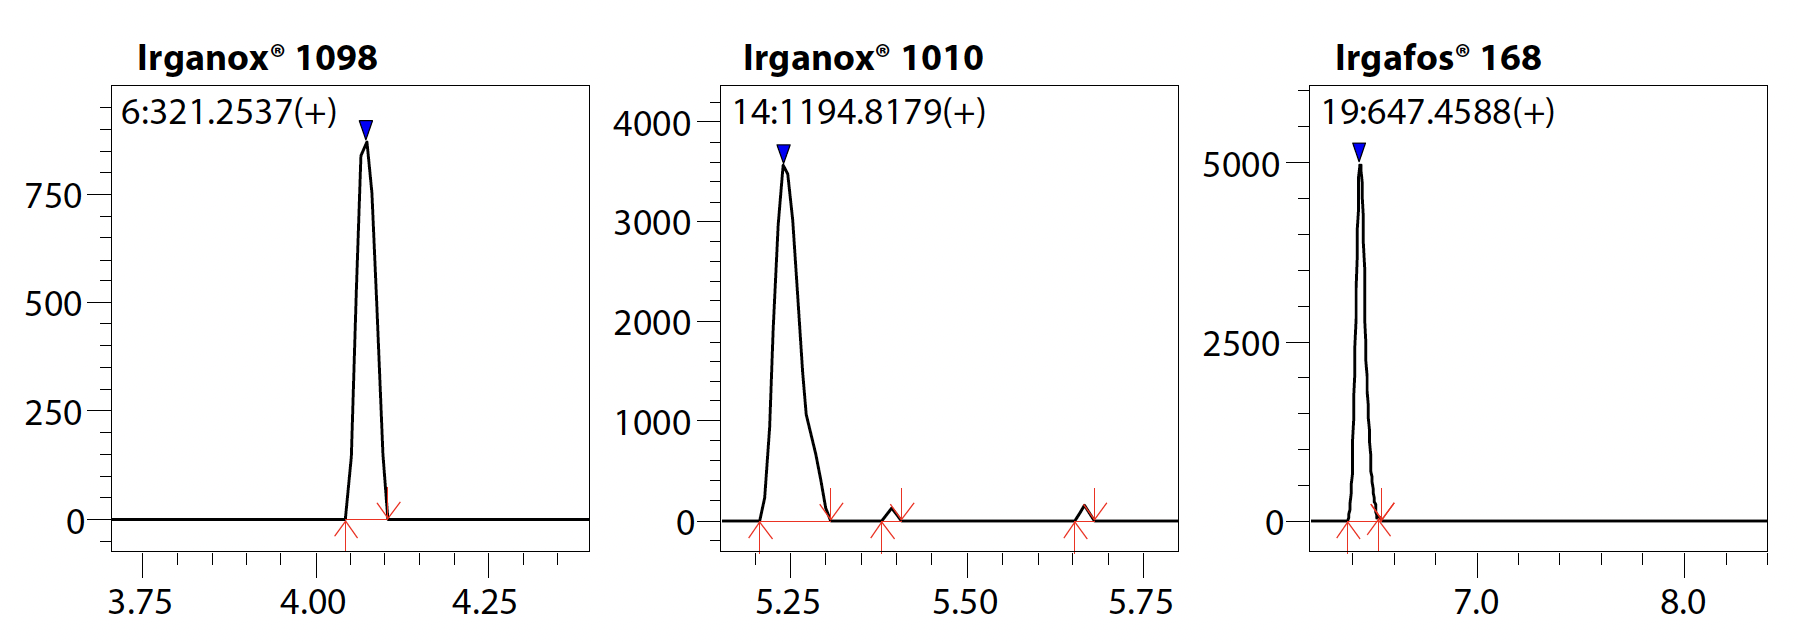
Samples of the food containers were extracted by the method described above and were diluted from 10 times to 1000 times with methanol. As a result of the quantitative analysis/ calculations, it was found that the concentration of Irgafos® 168 in the samples diluted 1000 times was from 1.85 to 40 ppb, and the concentrations in the packs and films were in the range of 37 to 800 mg/g. Table 3 shows the results of the quantitative analysis of each compound including Irgafos® 168, and Fig. 7 shows representative MS/MS chromatograms of the food A film.
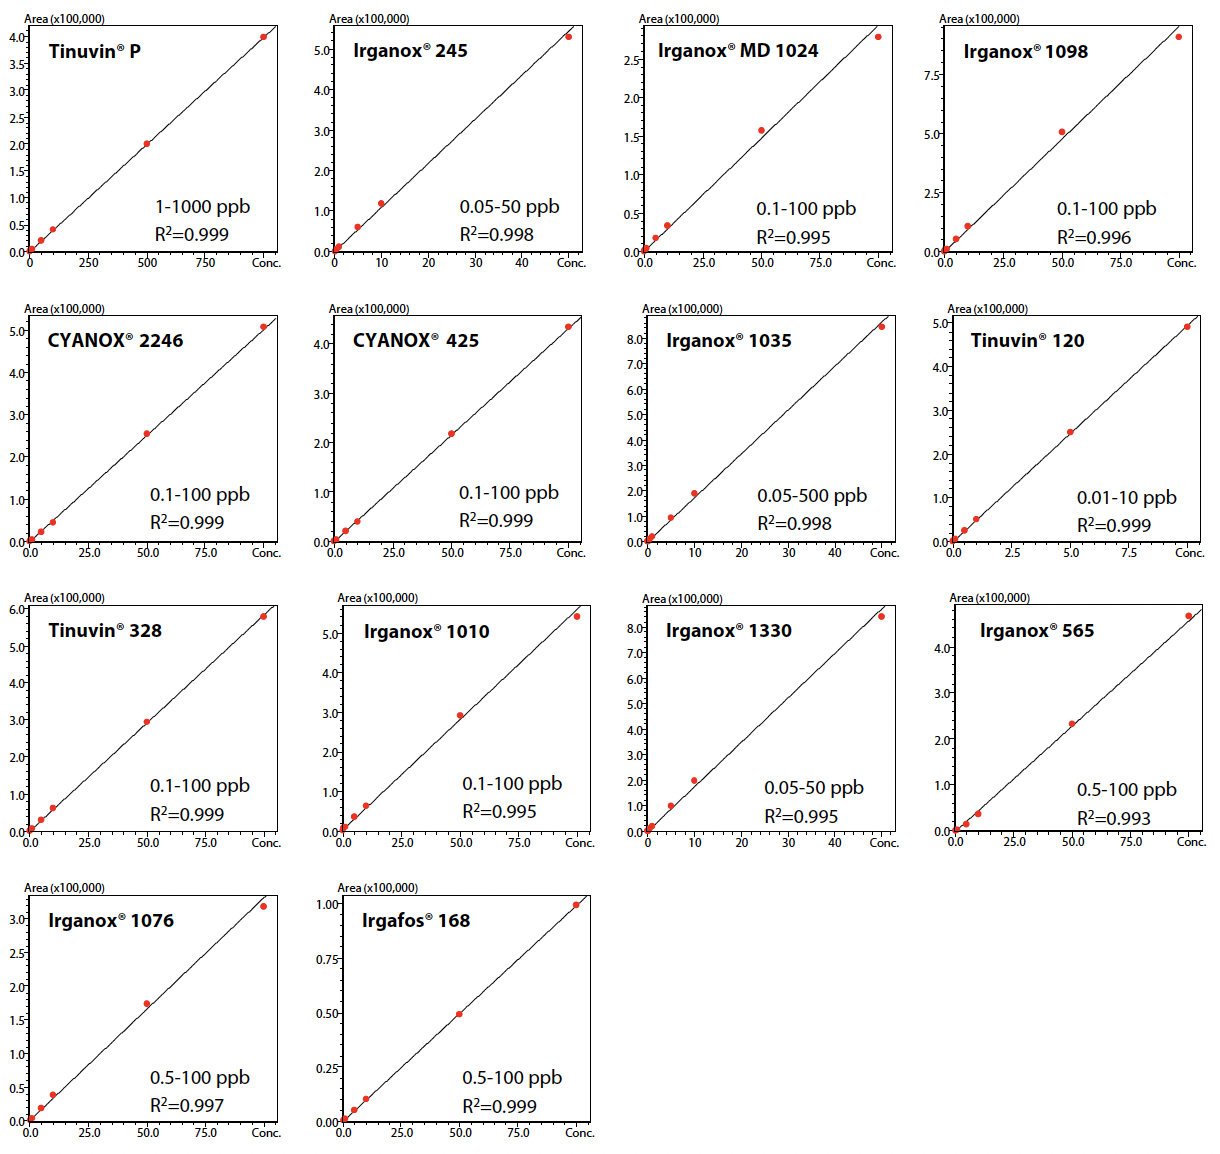
| Compound Name | Ionization Method | Precursor Ion | Monitor Ion | Range of Calibration Curve (ppb) | Coefficient of Determination (R2) |
| Tinuvin® P | ESI positive | 226.0975 | 120.0556 | 1-1000 | 0.999 |
| Irganox® 245 | ESI positive | 604.3844 | 177.1279 | 0.05-50 | 0.998 |
| Irganox® MD 1024 | ESI positive | 570.4265 | 181.0972 | 0.1-100 | 0.995 |
| Irganox® 1098 | ESI positive | 637.4939 | 321.2537 | 0.1-100 | 0.996 |
| CYANOX® 2246 | ESI negative | 339.2330 | 163.1128 | 0.1-100 | 0.999 |
| CYANOX® 425 | ESI negative | 367.2643 | 367.2643 | 0.1-100 | 0.999 |
| Irganox® 1035 | ESI positive | 660.4292 | 249.1485 | 0.05-50 | 0.998 |
| Tinuvin® 120 | ESI positive | 439.3207 | 233.1531 | 0.01-10 | 0.999 |
| Tinuvin® 328 | ESI positive | 352.2383 | 282.1601 | 0.1-100 | 0.999 |
| Irganox® 1010 | ESI positive | 1194.8179 | 1194.8179 | 0.1-100 | 0.995 |
| Irganox® 1330 | ESI positive | 792.6289 | 219.1743 | 0.05-50 | 0.995 |
| Irganox® 565 | ESI positive | 589.3968 | 250.1009 | 0.5-100 | 0.993 |
| Irganox® 1076 | ESI positive | 548.5037 | 475.4146 | 0.5-100 | 0.997 |
| Irgafos® 168 | ESI positive | 647.4588 | 647.4588 | 0.5-100 | 0.999 |
| Compound Name | Concentration (mg/g) | |||||||||
| Food A pack | Food A film | Food B pack | Food B film | Food C pack | Food C film | Food D pack | Food D film | Food E pack | Food E film | |
| Tinuvin® P | - | - | - | - | - | - | - | - | - | - |
| Irganox® 245 | - | - | - | 0.043 | - | - | - | - | - | - |
| Irganox® MD 1024 | 0.823 | 0.695 | 0.627 | 0.486 | 0.479 | 0.430 | 0.376 | 0.400 | 0.318 | 0.278 |
| Irganox® 1098 | - | 7.104 | - | 8.64 | - | - | - | - | - | - |
| CYANOX® 2246 | - | 0.021 | - | - | - | - | - | - | - | - |
| CYANOX® 425 | 0.130 | 3.132 | - | 0.069 | - | - | - | - | - | - |
| Irganox® 1035 | 0.011 | 0.012 | - | - | - | - | - | - | - | - |
| Tinuvin® 120 | - | 0.005 | - | - | - | - | - | - | - | - |
| Tinuvin® 328 | 0.024 | - | - | - | - | - | 0.268 | - | - | - |
| Irganox® 1010 | 9.544 | 51.094 | 1.698 | - | 14.054 | 76.426 | 6.260 | 58.466 | 15.218 | 113.920 |
| Irganox® 1330 | - | - | - | - | - | - | - | - | - | 0.004 |
| Irganox® 565 | - | 0.159 | - | - | - | - | - | - | - | 0.135 |
| Irganox® 1076 | 2.140 | 8.366 | - | 25.450 | 2.636 | 2.482 | 7.994 | 9.644 | 1.484 | 8.438 |
| Irgafos® 168 | 111.04 | 339.94 | 119.64 | 37.1 | 253.68 | 799.66 | 350.10 | 616.62 | 205.24 | 126.96 |
Conclusion
A workflow that includes the processes from detection to qualitative analysis and quantitative analysis of the functional additives contained in polymer materials was realized by using a Shimadzu LCMS-9030 quadrupole time-of-flight liquid chromatograph mass spectrometer and LabSolutions Insight Explore and ACD/MS Structure ID Suite. This technique is expected to contribute to efficient development and improvement of better synthetic polymer materials.