Experimental Approach
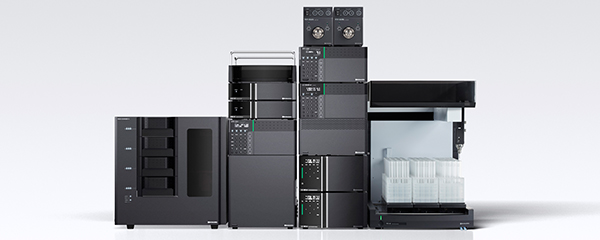
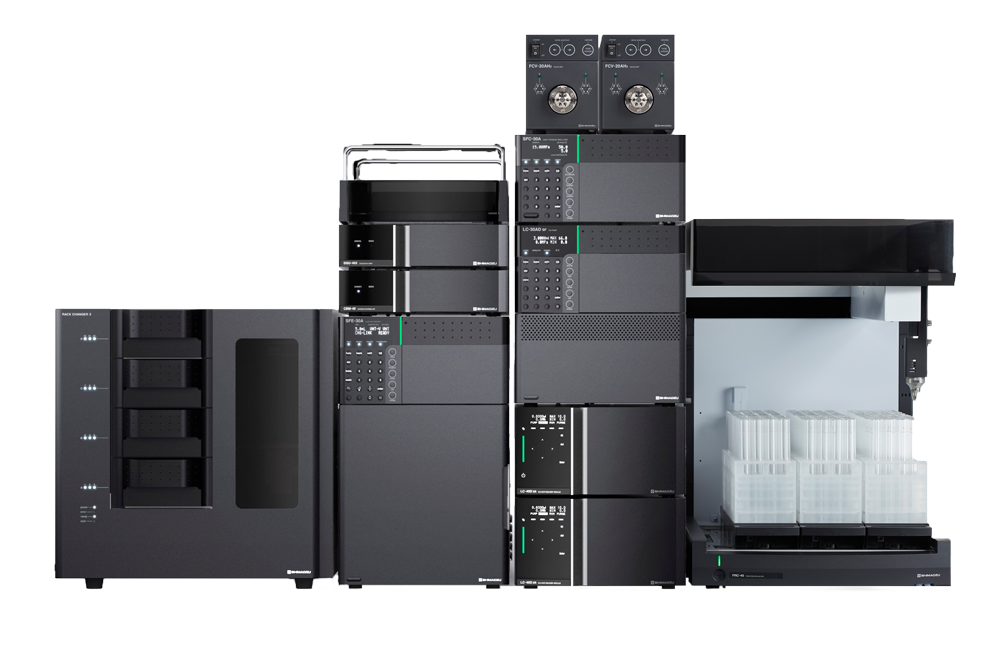
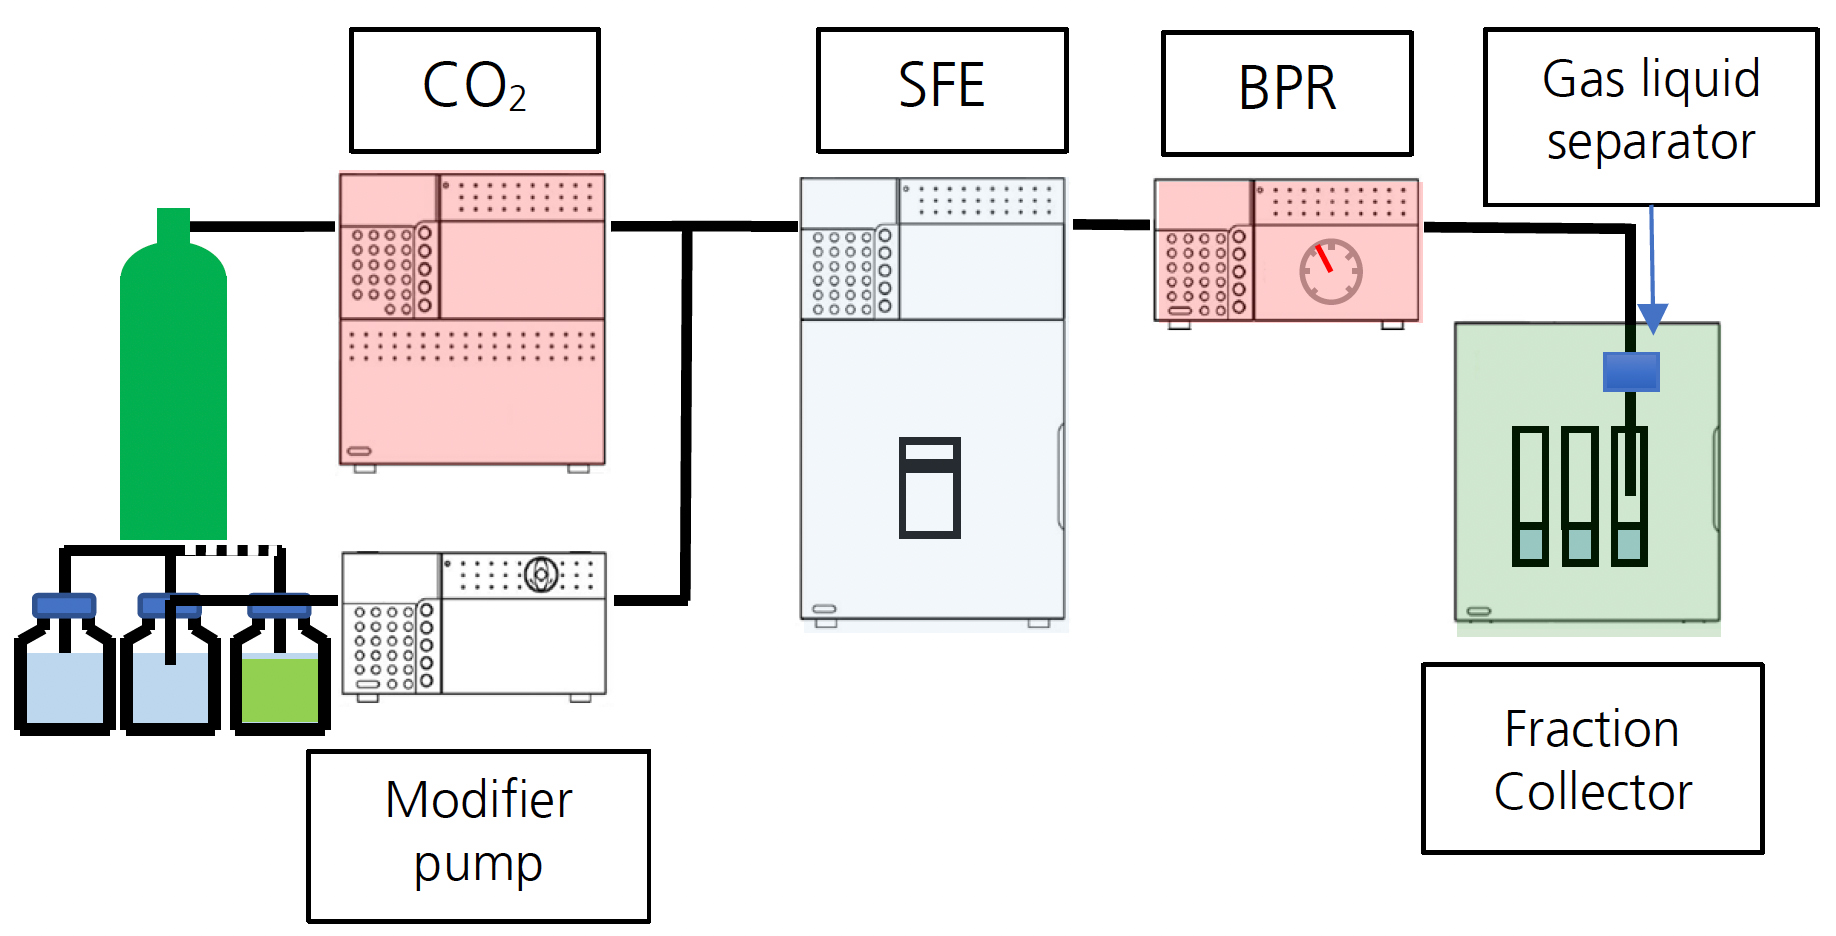
For this study, the Shimadzu Nexera UC offline SFE system (configuration shown in Figure 1) was employed. 0.5 grams of freeze-dried fish tissue was milled and mixed with 1 packet (1 gram) of Miyazaki Hydro-Protect and placed into a 5 mL extraction vessel for extraction.
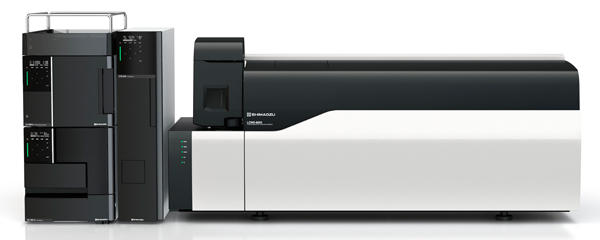
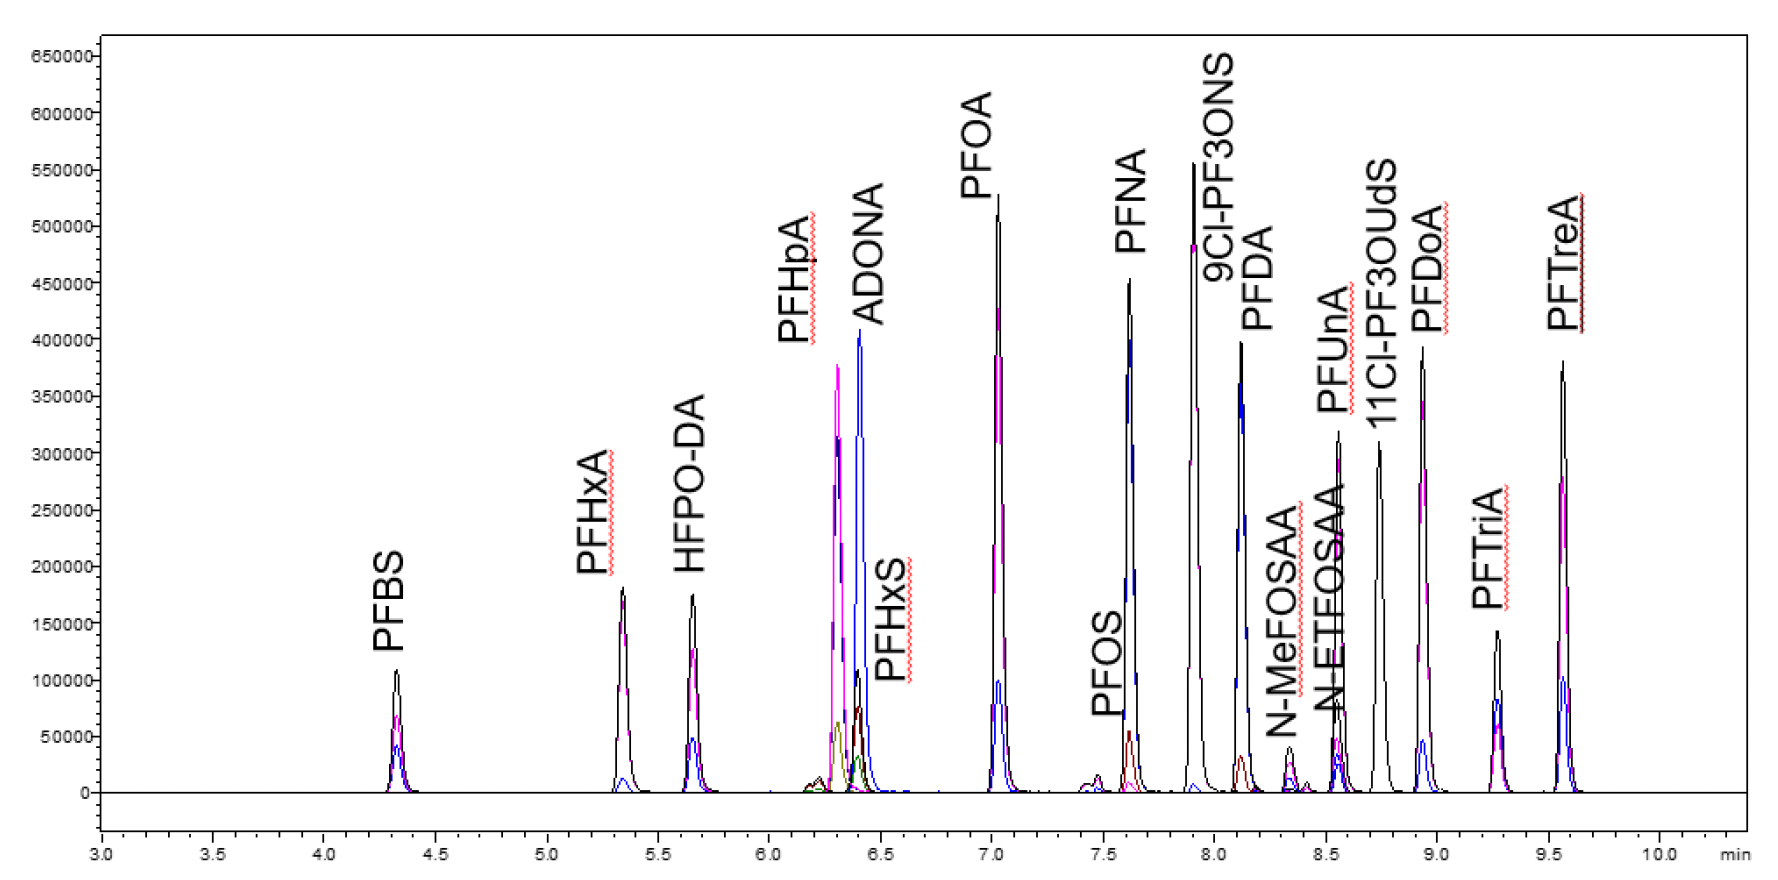
Optimized extraction conditions to maximize PFAS recoveries are shown in Table 1. After extraction, the sample was dried down under nitrogen and reconstituted with 1 mL of methanol. The sample was centrifuged and the supernatant was transferred to an LC vial. 1 uL of the supernatant was injected for LC-MS/MS analysis. Table 2 shows the LC-MS/MS conditions used for the Shimadzu LCMS-8050 for this study; a representative chromatogram is included in Figure 2.
| Item | Value |
| Mobile Phase | CO2/MeOH |
| Modifier Concentration | 20% MeOH |
| Flow Rate | 5 mL/min |
| Vessel Temperature | 60℃ |
| Extraction Cycles | 3 |
| Back Pressure | 20 MPa |
| Extraction Time | 45 minutes |
Table 1: SFE optimized method conditions
| Item | Value |
| Column | Shim-pack GIST C18 2.7 um 100 x 2.1 mm |
| Delay Column | XR-ODSII 3 x 75 mm |
| Mobile Phase | A: 10 mM ammonium acetate in H2O; B: MeOH |
| Flow Rate | 0.5 mL/min |
| Gradient | 0 min: 20% B, 9 min: 90% B, 11 min: 90% B, 11.5 min: 20% B, 15 min: 20% B |
| Oven Temperature | 35°C |
| Injection Volume | 1 μL |
| Ionization Mode | ESI (-) |
Table 2: LC-MS/MS method conditions used in Shimadzu LCMS-8050
Results and Discussion
Recovery, Linearity, Reproducibility
A set of experiments to identify the combination of CO2’s modifier and additives that maximized the extraction efficiency of 18 PFAS was first conducted in this work. While 100% CO2 can be effective in extracting nonpolar compounds, the addition of a cosolvent is often required in SFE to extract more polar compounds. Optimum extraction conditions were found to be 20% methanol without the need for additives. The 18 targets from this study showed recoveries over 95% with these conditions, as shown in Table 3.
Linearity of a matrix matched calibration curve, to minimize the impact from coextracted matrix components, was evaluated. Concentrations from 0.5 to 100 ng/g were spiked to a freeze-dried farm-raised trout fish tissue sample found to be free from PFAS contamination.
Linearity results are shown in Table 4 along with the determined limit of quantitation for each compound; r2 for all compounds was >0.9995 except for N-MeFOSAA (r2: 0.9994). Linearity results show accurate determinations for PFAS compounds can be obtained regardless of concentration levels.
Reproducibility results for supercritical fluid extractions were determined at three PFAS concentration levels: 2 ng/g, 20 ng/g and 100 ng/g. Extractions were performed in triplicated samples. Table 5 summarizes the variability of the extraction at each of the concentrations evaluated. %RSDs at 20 and 100 ng/g were less than 12% for all compounds evaluated. At 2 ng/g, %RSD was less than 25%, except for PFTriA (27%) and N-MeFOSAA (45%). These results demonstrate the reproducibility of SFE as a sample preparation technique.
| Compound | % recovery |
| PFBS | 98.7 |
| PFHxA | 105.9 |
| HFPO-DA | 97.4 |
| PFHxS | 102.7 |
| PFHpA | 100.5 |
| ADONA | 100.7 |
| PFOA | 104.2 |
| PFNA | 101.9 |
| PFOS | 98.1 |
| 9Cl-PF3ONS | 100.5 |
| PFDA/td> | 99.9 |
| N-MeFOSAA | 102.2 |
| N-EtFOSAA | 97.6 |
| PFUnA | 94.6 |
| 11Cl-PF3OUds | 102.2 |
| PFDoA | 96.3 |
| PFTriA | 99.8 |
| PFTreA | 97.2 |
Quantitative Analysis of Fish Samples
Three fish samples with unknown PFAS concentrations were then evaluated with this method. The samples were wild caught Walleye, wild caught Large Mouth Bass, and farm raised Trout. Figure 3 shows the LC-MS/MS chromatogram of an extracted sample from each fish’s type. Table 6 shows the concentration of PFAS determined in each type of fish. The wild caught Walleye and Large Mouth Bass were found to contain the largest amounts of PFOS, PFDA, and PFUnA. No PFAS compounds were detected above the LOQ in the farm raised Trout sample.
| Lowest Calibration Standard (LOQ) | Highest Calibration Standard | ||
| ng/g spiked on fish | ng/g spiked on fish | ||
| PFBS | 0.5 | 100 | 0.9999 |
| PFHxA | 0.5 | 100 | 0.9995 |
| HFPO-DA | 1 | 100 | 0.9997 |
| PFHpA | 1 | 100 | 0.9996 |
| PFHxS | 0.5 | 100 | 0.9999 |
| ADONA | 0.5 | 100 | 0.9997 |
| PFOA | 0.5 | 100 | 0.9997 |
| PFNA | 0.5 | 100 | 0.9997 |
| PFOS | 2 | 100 | 0.9999 |
| 9Cl-PF3ONS | 1 | 100 | 0.9995 |
| PFDA | 0.5 | 100 | 0.9998 |
| N-MeFOSAA | 2 | 100 | 0.9994 |
| N-ETFOSAA | 1 | 100 | 0.9999 |
| PFUnA | 1 | 100 | 0.9997 |
| 11Cl-PF3OUdS | 0.5 | 100 | 0.9999 |
| PFDoA | 1 | 100 | 0.9996 |
| PFTriA | 2 | 100 | 0.9997 |
| PFTreA | 1 | 100 | 0.9995 |
Table 4: Linearity of PFAS compounds spiked onto fish tissue
| %RSD | |||
| 100 ng/g | 20 ng/g | 2 ng/g | |
| PFBS | 2.3 | 7.9 | 21.7 |
| PFHxA | 4.9 | 4.1 | 15.6 |
| HFPO-DA | 3.9 | 4.4 | 9.9 |
| PFHxS | 4.2 | 4.4 | 19.9 |
| PFHpA | 2.6 | 4.9 | 2.4 |
| ADONA | 3.9 | 3.2 | 13.2 |
| PFOA | 2.9 | 3.1 | 13.1 |
| PFNA | 3.5 | 3.6 | 18.1 |
| PFOS | 4.1 | 3.9 | 22.1 |
| 9Cl-PF3ONS | 2.5 | 1.3 | 3.6 |
| PFDA | 1.6 | 7.4 | 20.9 |
| N-MeFOSAA | 9.5 | 9.6 | 44.7 |
| N-EtFOSAA | 8.4 | 6.2 | 10.7 |
| PFUnA | 2.3 | 2.8 | 18.4 |
| 11Cl-PF3OUds | 4.1 | 4.9 | 7.8 |
| PFDoA | 4.7 | 5.8 | 15.9 |
| PFTriA | 4.4 | 11.6 | 26.8 |
| PFTreA | 2.3 | 3.6 | 11.5 |
Table 5: Reproducibility of PFAS SFE extractions (n=3)
(a) Wild caught Large Mouth Bass
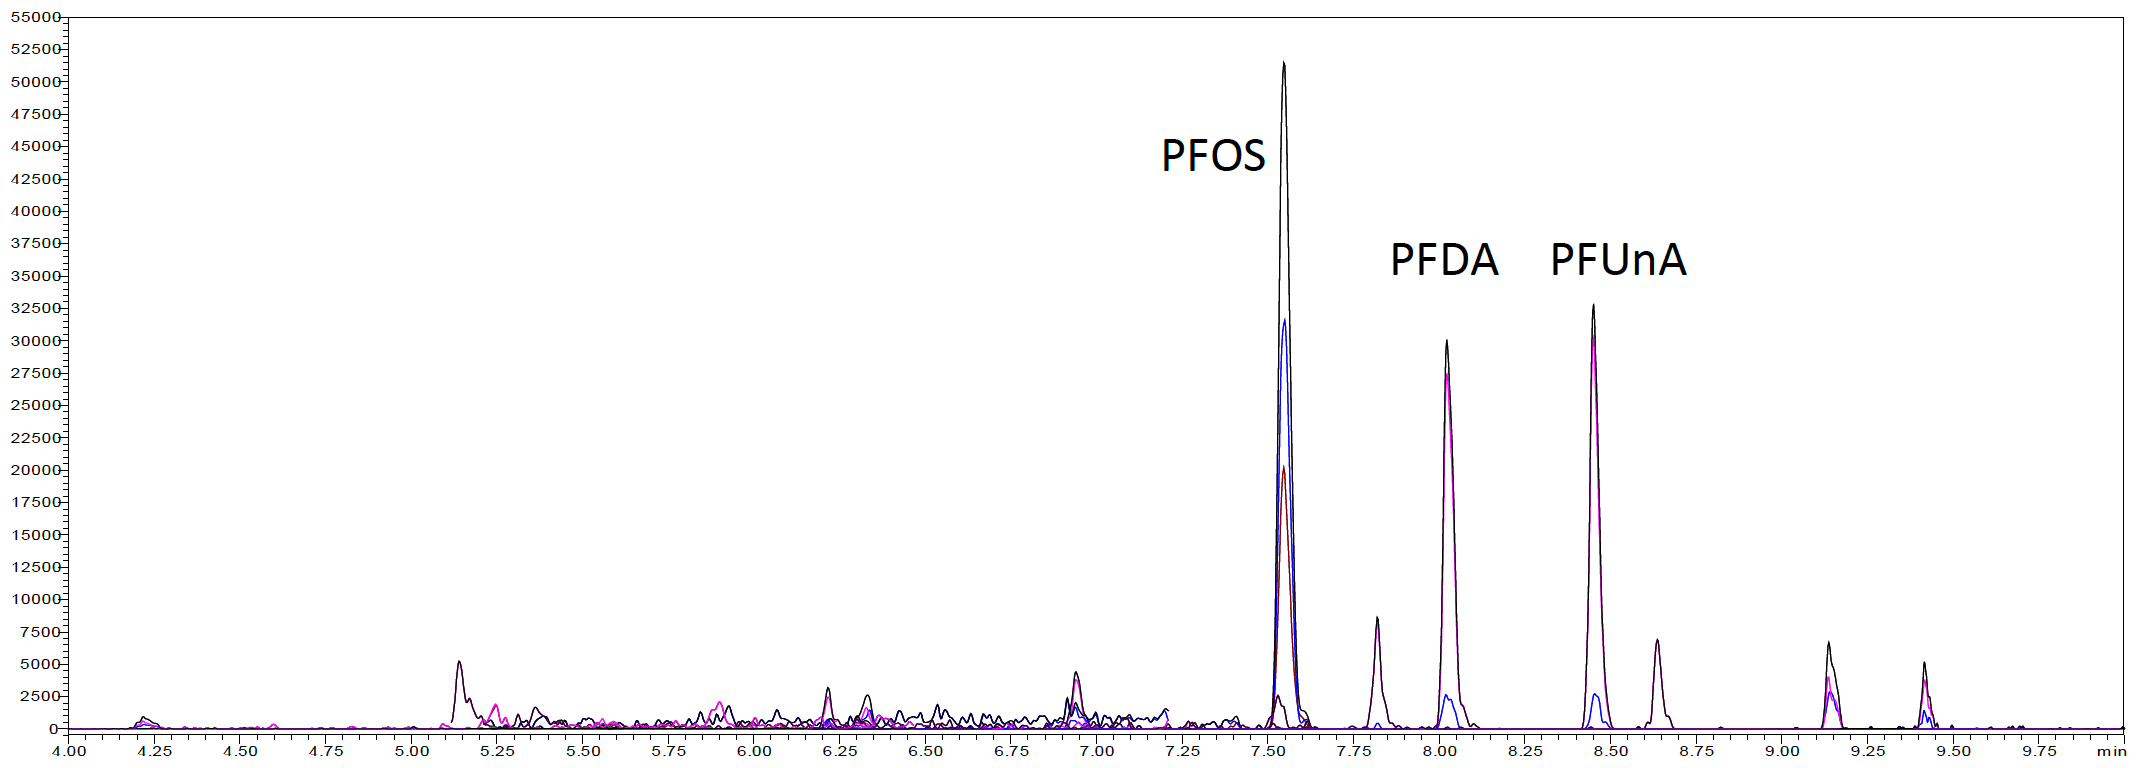
(b) Wild caught Walleye
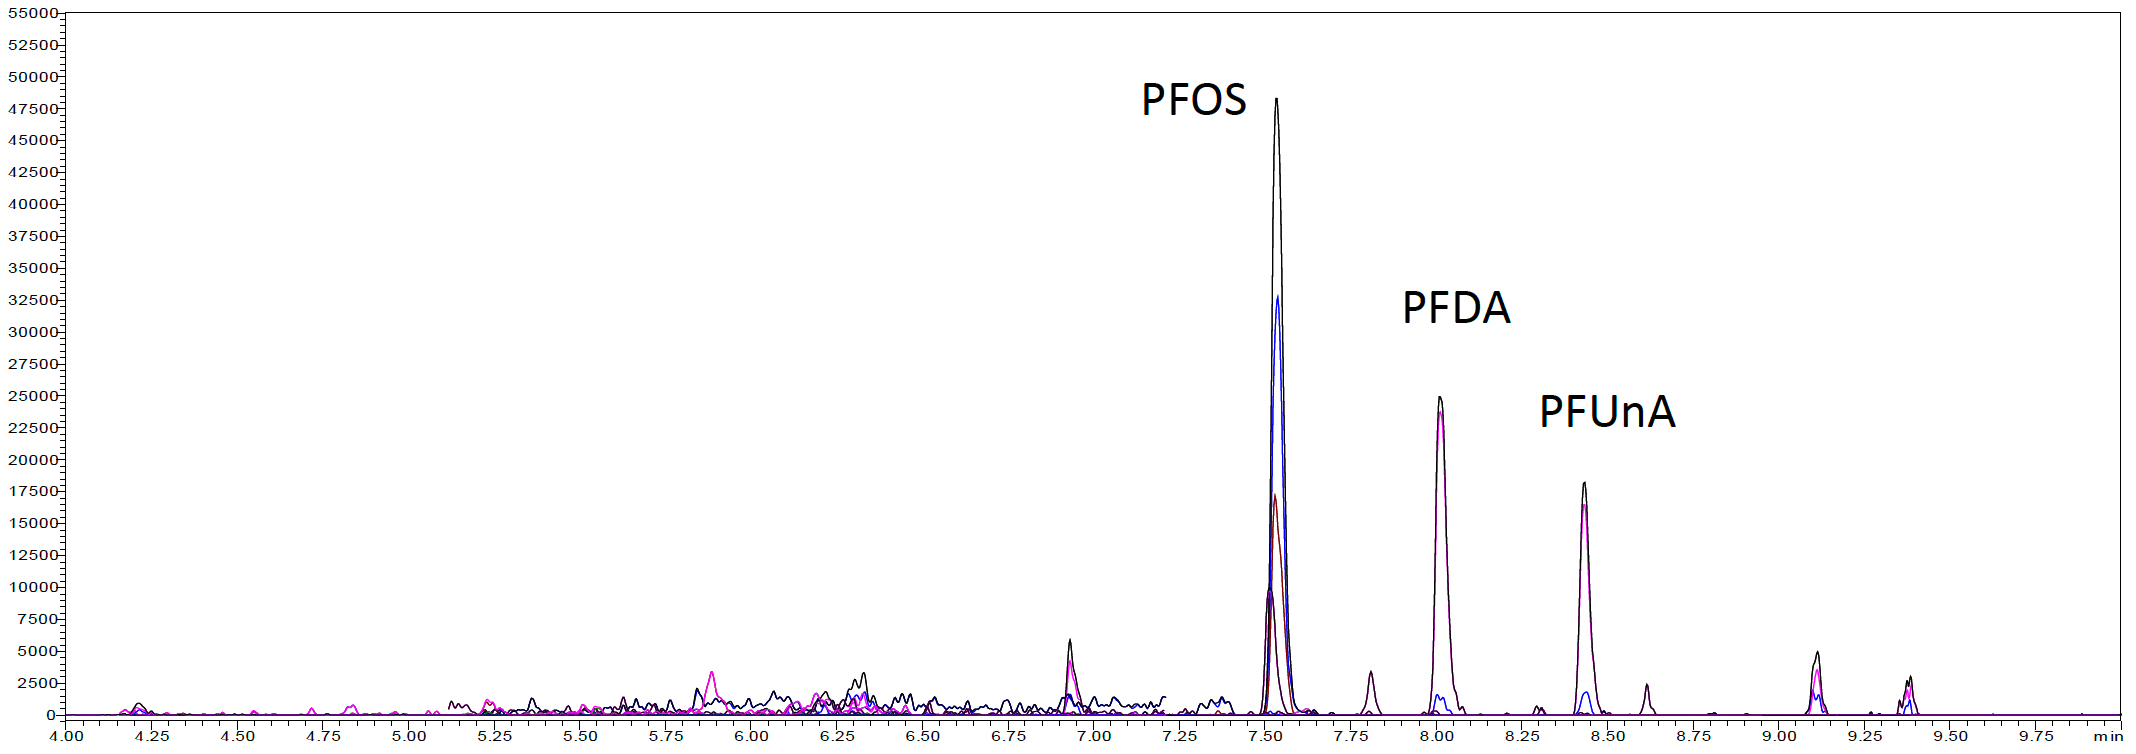
(c) Farm raised Trout
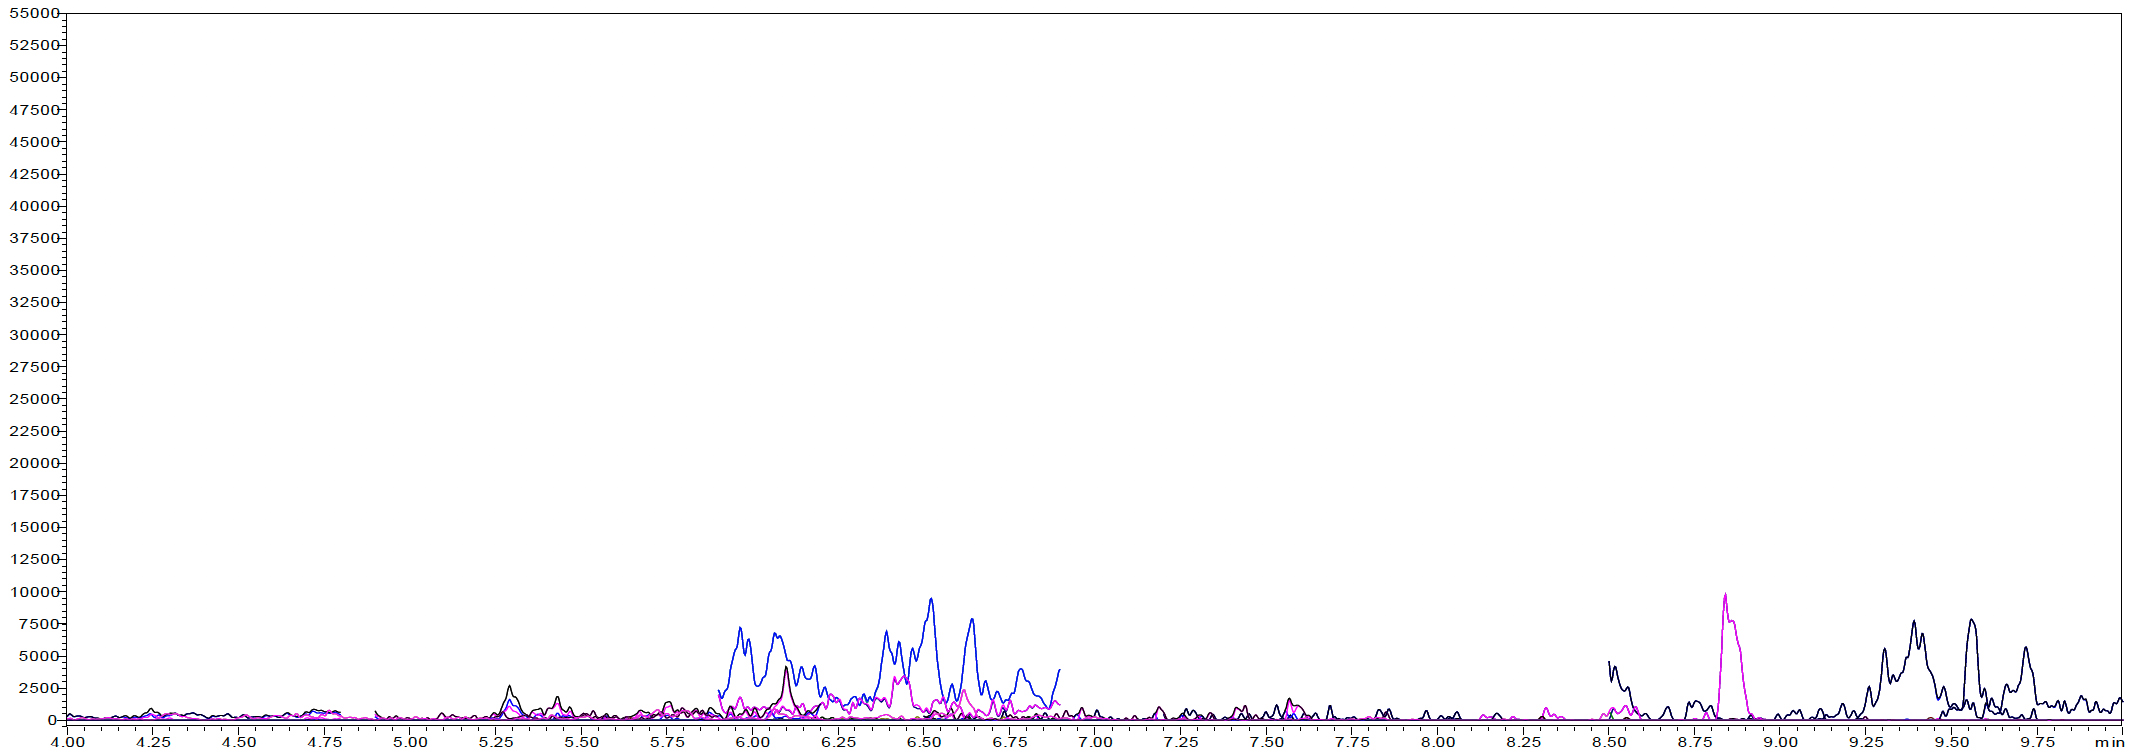
Figure 3: SFE extracted sample chromatograms from (a) Wild caught Large Mouth Bass, (b) Wild caught Walleye, and (c) Farm raised Trout
| Walleye ng/g | Large Mouth Bass ng/g | Farm raised Trout ng/g | |
| PFBS | 1.0 | 1.6 | n.d. |
| PFHxA | n.d. | n.d. | n.d. |
| HFPO-DA | n.d. | n.d. | n.d. |
| PFHxS | n.d. | n.d. | n.d. |
| PFHpA | n.d. | n.d. | n.d. |
| ADONA | n.d. | n.d. | n.d. |
| PFOA | 1.0 | 1.4 | n.d. |
| PFNA | 2.4 | 1.1 | n.d. |
| PFOS | 51.7 | 77.3 | n.d. |
| 9Cl-PF3ONS | 1.0 | 2.7 | n.d. |
| PFDA | 6.7 | 10.5 | n.d. |
| N-MeFOSAA | n.d. | n.d. | n.d. |
| MN-MeFOSAA | n.d. | n.d. | n.d. |
| N-EtFOSAA | n.d. | n.d. | n.d. |
| PFUnA | 5.7 | 14.2 | n.d. |
| 11Cl-PF3OUds | 0.7 | 3.0 | n.d. |
| PFDoA | 2.8 | 4.5 | n.d. |
| PFTriA | 4.1 | 7.3 | n.d. |
| PFTreA | 1.4 | 2.3 | n.d. |
Table 6: Concentration of 18 PFAS in unknown fish samples
Conclusion
A novel supercritical fluid extraction method, using the Shimadzu Nexera UC offline SFE system, for the extraction of PFAS compounds from fish tissue was evaluated and provided excellent results for recovery, linearity, and reproducibility. The results summarized here demonstrate the suitability of SFE as a sample preparation technique for PFAS analysis.
This sample preparation technique can be automated to allow the processing of up to 48 samples per batch to help reduce manual labor in testing laboratories.
Acknowledgement
Shimadzu acknowledges Pennsylvania Department of Environmental Protection Bureau of Laboratories for providing the samples analyzed in this study.