As everyone knows, it’s not just the taste and aroma that can define the quality of foods. Texture assessment is an essential parameter for evaluating food quality, especially when discussing meat-mimicking products. Material testers with appropriate jigs can clarify the properties related to the texture, such as hardness. Taste, aroma, and texture are independent factors and, therefore, should be discussed separately. However, we sometimes want to rate the “total quality” of the food products. Multivariate analysis can visualize the “distance” of each sample regarding all these factors. Coming to this assessment, the ambiguous term “quality” could be concretely and comprehensively solidified from the point of view of the influential factors that foods inherently have.
Here, we introduce the result of four different plant-based meat products with this quality evaluation approach.
Sample Preparation
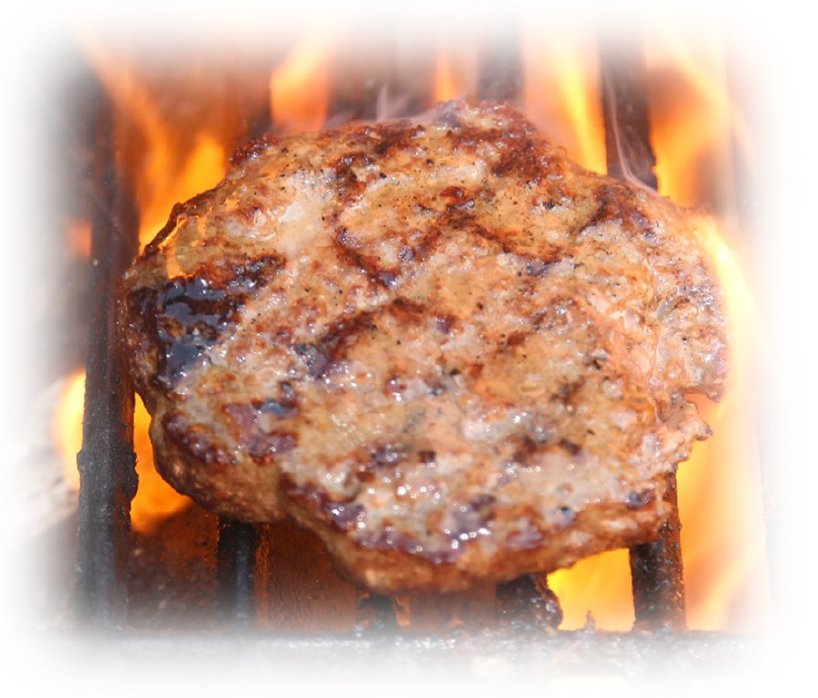
We prepared four different commercially available plant-based meat products (Product 1 to 4). They are all substitutes for ground beef. They were cooked before analysis.
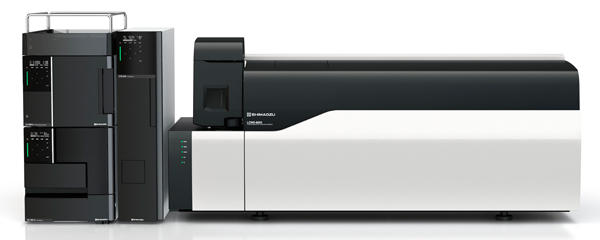
LCMS Analysis for Metabolites
LC-MS is one of the most appropriate instruments for investigating taste-related hydrophilic compounds in food samples.
- Sample Preparation
Weigh 100 mg of the samples that were cooked in the same way as with the material tester analysis (see in Material Tester Analysis) into a microcentrifuge tube. Put 0.75 mL of Methanol into the tube with a 5 mm diameter zirconia ball to grind the sample with a vibratory ball mill. After centrifugation, supernatant was taken and filtration was performed with a 0.45 mm pore size filter. The filtered solution was stored at -20°C as an original stock sample solution. The sample solution for metabolites analysis was prepared by diluting the stock sample solution to 5000 times with water to minimize the matrix effect.
- LC-MS Analysis
The LC/MS/MS Method Package for Primary Metabolites was utilized to develop the method for the analysis. This method package allows monitoring of 97 hydrophilic metabolites with minimal preparation for standards.
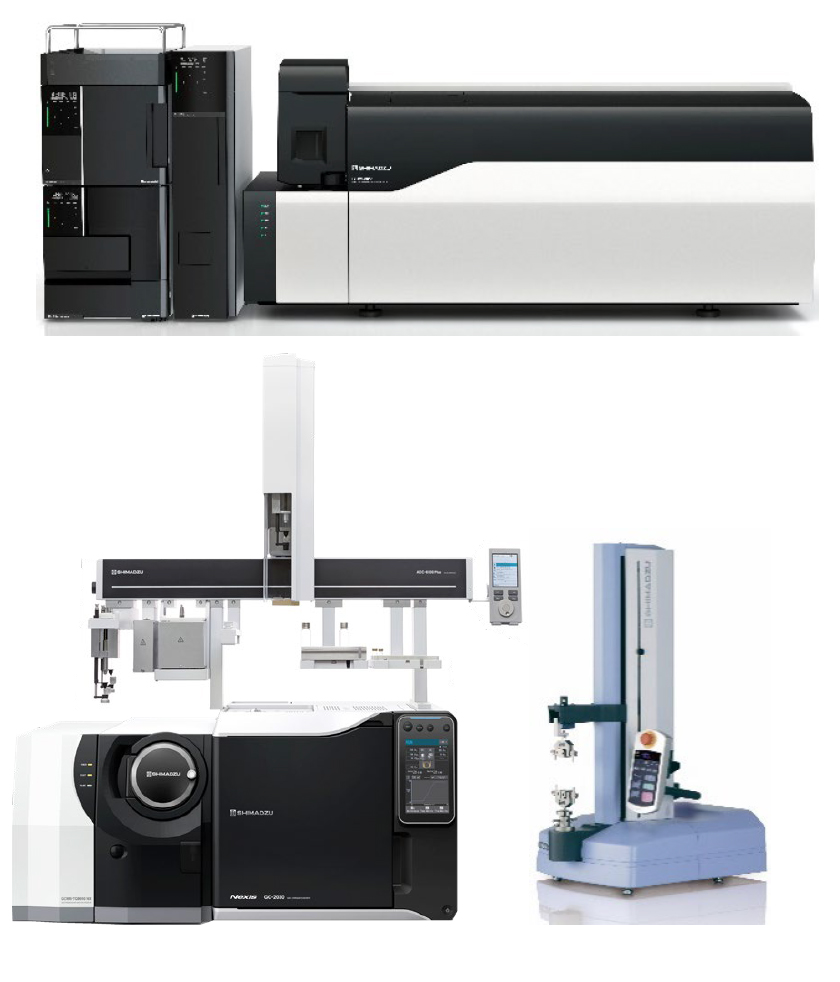
| Instrument | LCMS-8050 |
| Column | Discovery ® HS F5-3 15 cm x 2.1 mm 3µm |
| Mobile Phase A | 0.1 % Formic Acid in Water |
| Mobile Phase B | Acetonitrile |
| Analytical Mode | MRM |
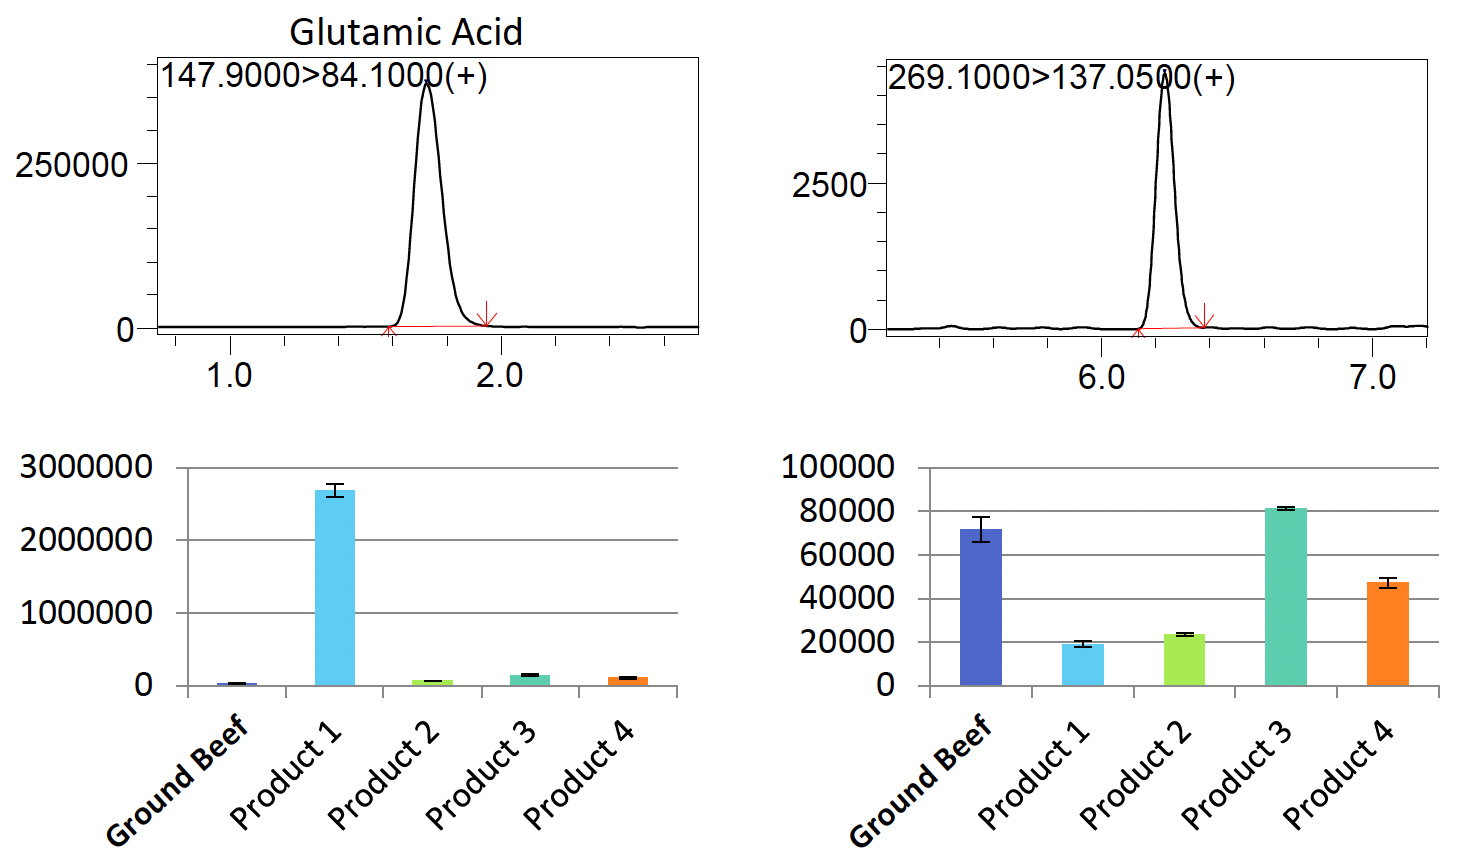
It was confirmed that most compounds showed good recovery in the range of 80-120% in diluted sample solvents, and all 55 compound peak area values were considered as relative concentrations in each sample. Peak shapes of Glutamic Acid and Inosine of Product 1 are shown in Fig. 1.
LC-MS Analysis for Sugar
Another LC-MS analysis was carried out to assesssugars.
- Sample Preparation
Most of the procedures are the same as the analysisfor metabolites. The sample solution for sugar analysis was prepared by diluting the stock sample solution to 500 times with acetonitrile.
- LC-MS Analysis:
The method was developed under the conditions below.
| Instrument | LCMS-8050 |
| Column | Asahipak NH2P-50 2D, 100 Å, 5 μm, 2 x 150 mm |
| Mobile Phase A | Water |
| Mobile Phase B | Acetonitrile |
| Analytical Mode | MRM |
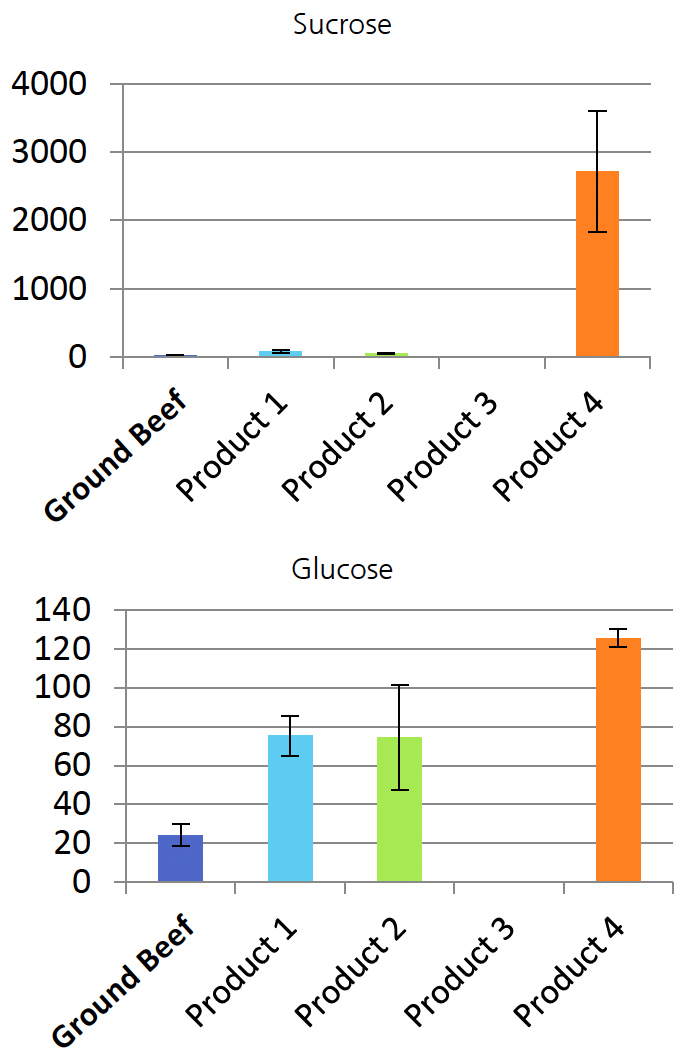
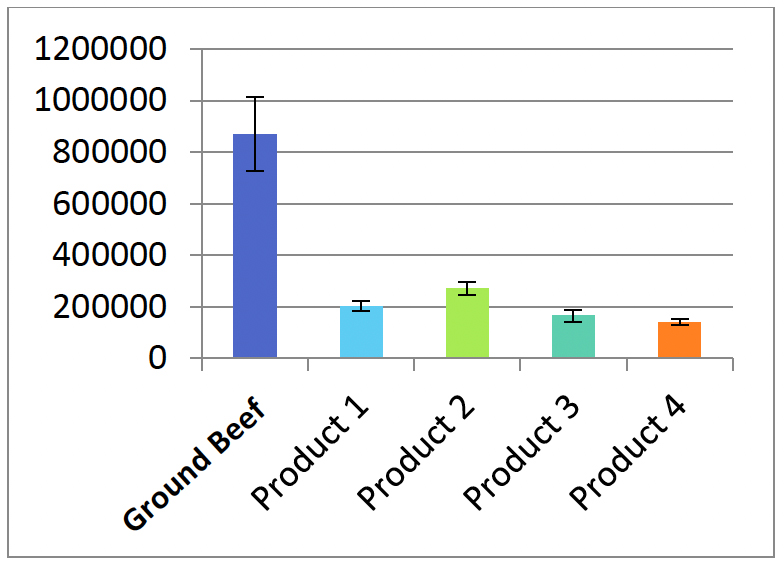
Six sugars were successfully detected. In this case, due to the level of dilution, the matrix effect cannot be utterly excluded from the analysis. Therefore, the standard addition method was performed to assess their concentration. Some of the sugars showed interesting differences between the samples. As examples, the results of Sucrose and Glucose are shown in Fig. 2.
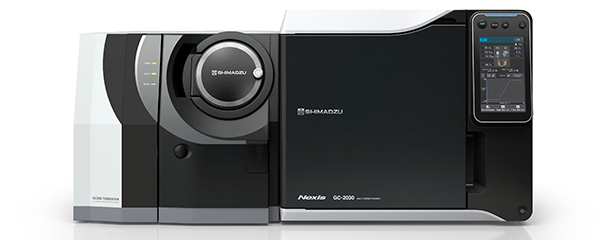
| Instrument | GCMS-TQ8050 + AOC-6000 |
| SPME Fiber | Divinylbenzene/Carboxen/Poly- dimethylsiloxane (DVB/CAR/PDMS) |
| Column | SH-Rxi-5MS, 30 m x 0.25 mm, 0.25 μm |
| Carrier Gas | Helium |
| Mode | Scan (m/z: 35 – 500) |
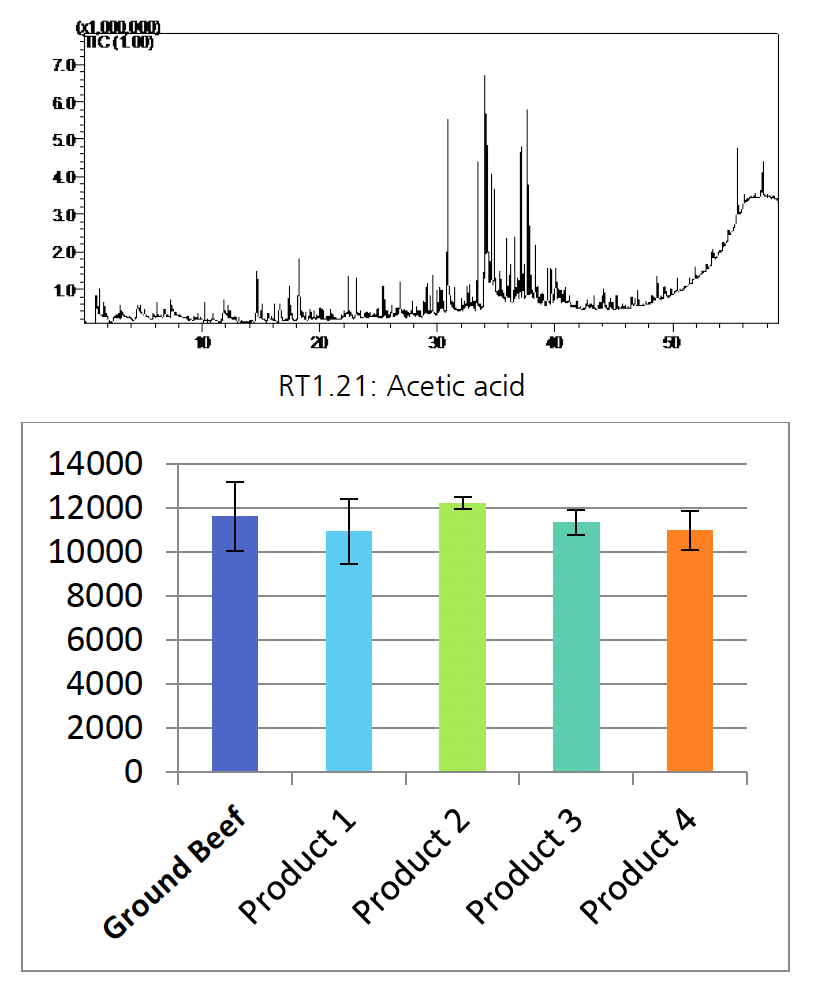
As shown in Fig. 3, numerous peaks were detected from each sample and some of the peaks were commonly detected from some samples. We carefully selected the peaks where the height and the area were stable over repetition. The spectra of these reliable peaks were searched in a commercially available spectra library. We also assessed the area value of these peaks between the samples. The area values should be considered as a relative concentration of the analytes because there should be less matrix effect in GC-MS analysis. Fig. 3 shows some examples of the values of each sample.
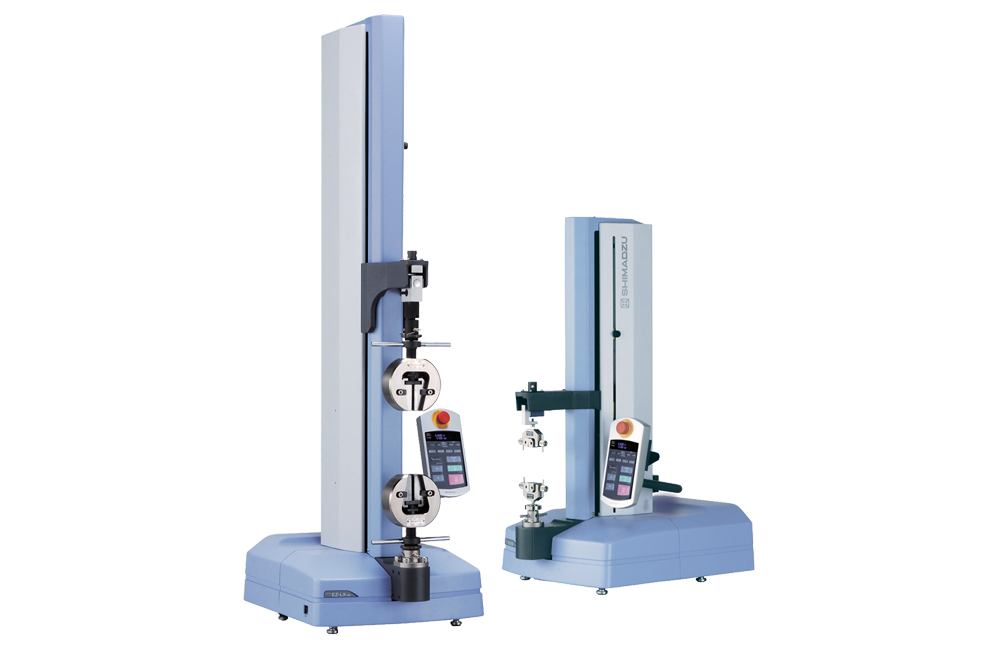
Material Tester Analysis for Texture
Material testing instruments can assess the texture offood samples without any subjectivity.
- Sample Preparation
25 g of the samples were compressed to the sameshape mold. The mold is truncated-cone-shaped withan upper and lower diameter of 2.5 cm and 4 cm,respectively. The molded samples were then put intoa 200°C oven for 20 min. The samples were testedwhen the internal temperature was around 65°C.
- Material tester analysis
Food texture analyzer EZ Test was utilized.
| Instrument | EZ Test |
| Software | TRAPEZIUMX |
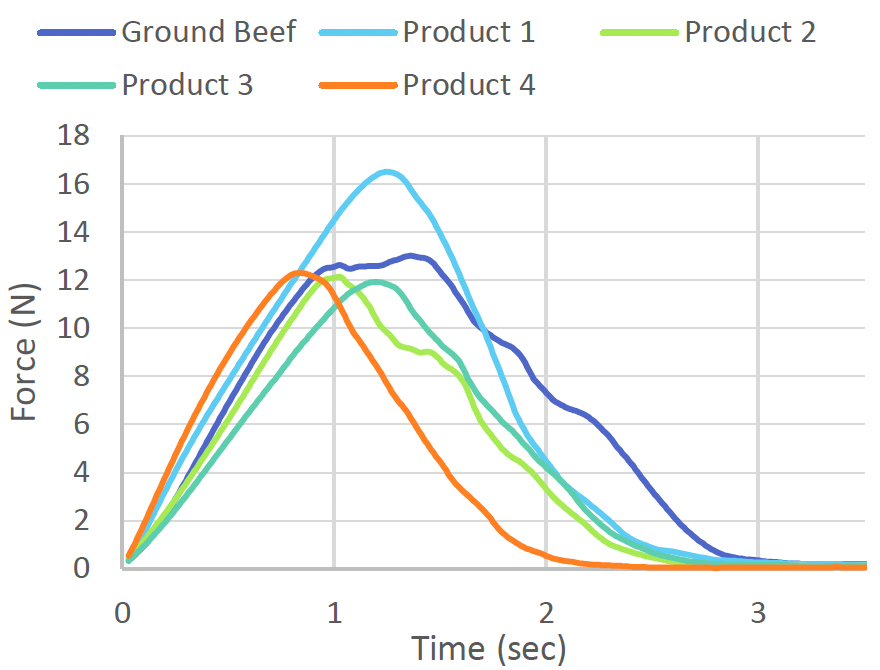
The force profile when a jig starts pressing the sample is recorded. A cylinder-shaped jig whose diameter is 10 mm was moving down with constant velocity until it completely penetrated the sample. The profile recorded in this experiment is shown in Fig. 4. Force profiles are basically similar to each other, though there are slight differences in their shape. This difference should be reflected in each sample’s property of texture. The test force indicates hardness. The larger the test force, the higher the hardness. A longer time to max force or a longer stroke to max force indicates more cohesiveness.
As shown in Fig. 4, a peak was detected from each sample at a certain point. This point, max force at the point, and waveform can be an evaluation index for hardness, cohesiveness, and so on. We can quantify the texture of food like this.
Multivariate Analysis
We summarized the data, including LC-MS, GC-MS and Material Tester analysis, for principal component analysis. All the data were summarized in one table (Fig. 5). The values in the tables are the peak areas in LC-MS / GC-MS analysis, and force intensities in the Material Tester, respectively. These values are then standardized with their average and standard deviation not to get biased in rows that have a different order of absolute values.
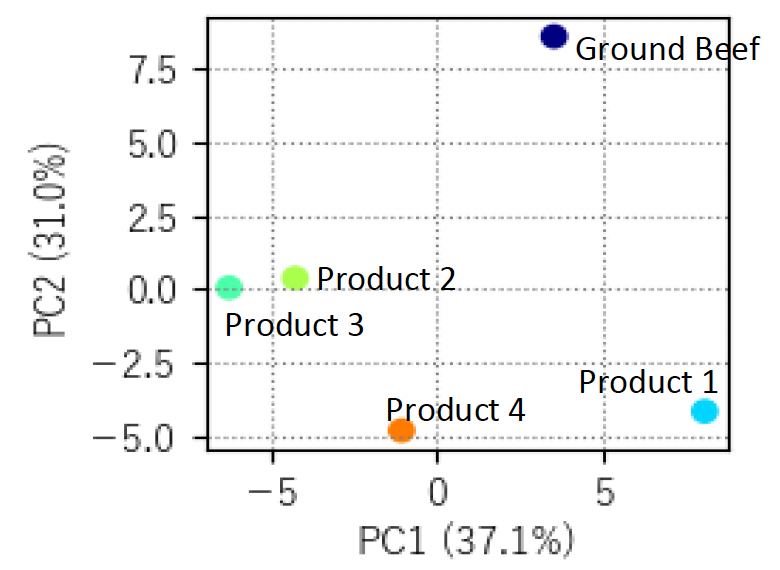
The resulting score plot from principal component analysis is shown in Fig. 6. The score plot can be interpreted as the “total similarity” of each sample, pertaining to the taste, aroma and texture. The more the pattern of the data are alike, the closer the dots of the samples get to each other. This allows us to review the similarity of each sample without any subjective factors.
| Experiment | Title | Ground Beef | Product 1 | Product 2 | Product 3 | Product 4 |
| LC-MS (Metabolites) | Cystine | 0.00 | 5133.67 | 0.00 | 0.00 | 0.00 |
| Asparagine | 3233.33 | 4662.67 | 5600.67 | 8911.00 | 5485.00 | |
| Aspartic acid | 8942.67 | 25824.67 | 11168.33 | 26395.33 | 12748.00 | |
| ⋮ | ⋮ | ⋮ | ⋮ | ⋮ | ⋮ | |
| LC-MS (Sugars) | Sucrose | 24.16 | 82.57 | 51.60 | 1.91 | 2718.60 |
| Maltose | 7.15 | 18.74 | 5.77 | 1.20 | 161.06 | |
| Lactose | 8.35 | 25.02 | 18.52 | 0.99 | 67.78 | |
| ⋮ | ⋮ | ⋮ | ⋮ | ⋮ | ⋮ | |
| GC-MS | l-Alanine ethylamide | 3800125.00 | 3194828.67 | 3535825.67 | 3851375.67 | 3674014.00 |
| Acetic acid | 11625.00 | 10922.33 | 12232.00 | 11354.33 | 10993.33 | |
| cis-4,5-Epoxy-(E)-2-decenal | 28785.00 | 28580.33 | 39956.67 | 48981.33 | 39483.33 | |
| ⋮ | ⋮ | ⋮ | ⋮ | ⋮ | ⋮ | |
| Material Tester | Max Force | 16.37 | 16.76 | 12.71 | 13.11 | 12.55 |
| Time when Max Force | 1.42 | 1.28 | 1.04 | 1.21 | 0.87 | |
| Stroke when Max Force | 14.17 | 12.83 | 10.40 | 12.10 | 8.67 |
Fig. 5: All the data from each experiment were summarized in the same table for carrying out the multivariate analysis. The values are before standardization. Totally 94 sets (rows) of data were simultaneously analyzed.
Conclusion
Our LC-MS, GC-MS and Material Tester have the possibility to assess the total quality of plant-based meat products, including taste, aroma and texture, respectively. Moreover, combining these data allows us to evaluate the total quality of the product. This strategy is not only for plant-based meat but also available for all food product quality.