Introduction
Monoclonal antibodies (mAbs) are well-established biotherapeutics for a wide range of diagnostic and clinical applications. The newly emerging biosimilars are increasing in popularity in biopharmaceuticals because of the cost savings. However, biosimilars can undergo various post-translational modifications in manufacturing processes, including sialylation, deamidation, C-terminal lysine cleavage, glycosylation, succinimide formation, oxidation and so forth. These modifications can lead to variations of charge distribution that potentially affect the biological activity and stability of the products. Therefore, characterization and monitoring of charge variants of mAb biosimilars are critical quality requirements to ensure the stability and process consistency in drug development.
Conventionally, ion exchange chromatography (IEX) with salt-gradient is the gold standard method for charge-sensitive antibody analysis. A key challenge of salt-gradient is that the method parameters often need to be optimized for each individual protein. In 2009, Genentech first reported the use of IEX with pH-gradient for mAb charge variant separations [1]. It was found that mAbs with isoelectric points in the range of pH 7~9 could be well separated. Moreover, the approach was more generic and could easily be used to separate different charge variants in a wide range of antibodies.
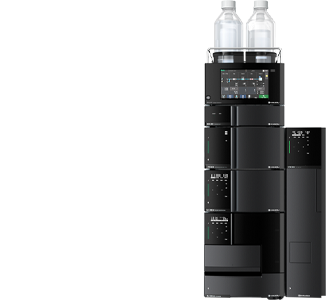
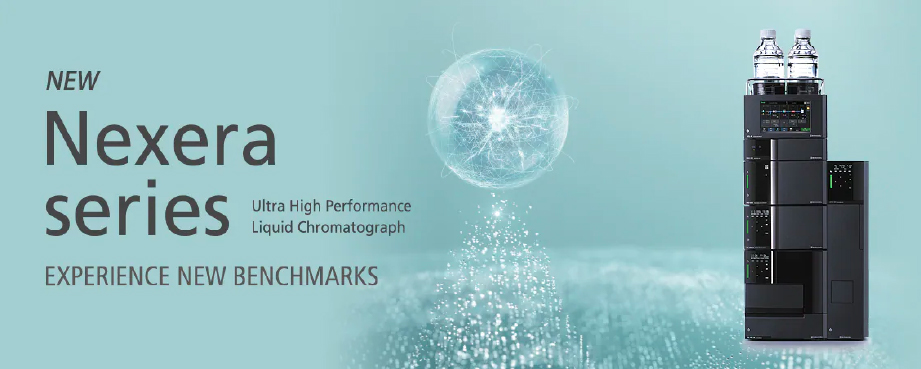
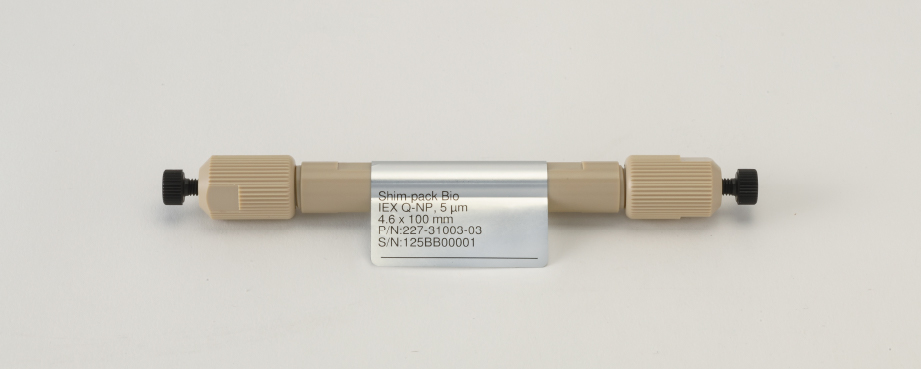
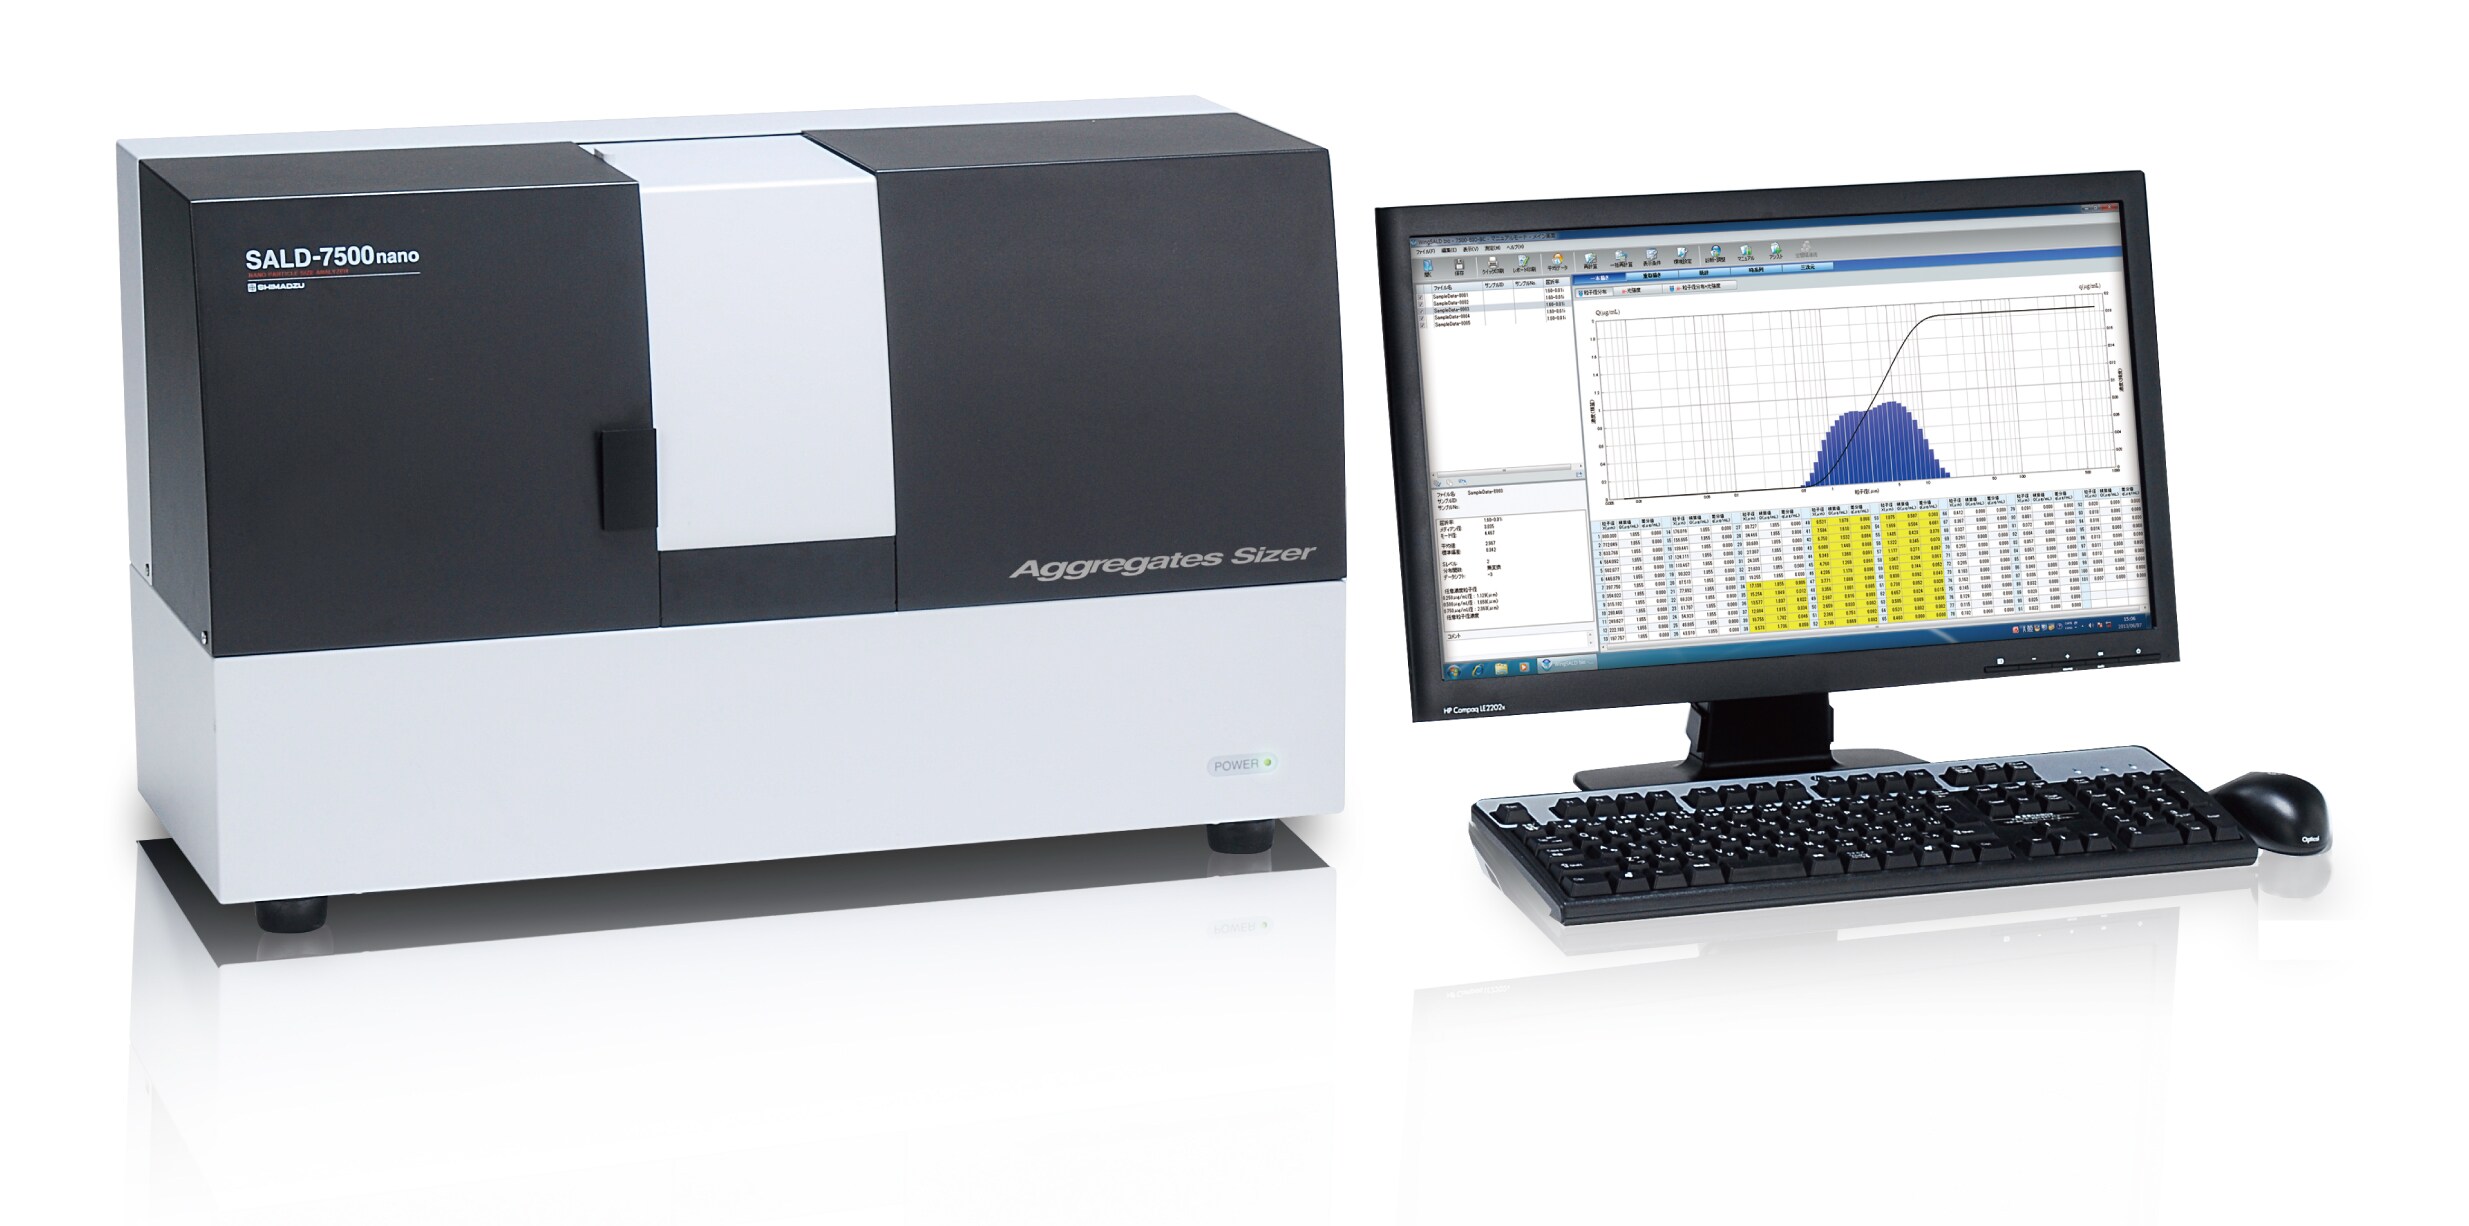
In this study, we describe both salt-gradient and pHgradient methods for separating the charge variants of bevacizumab biosimilar using Shimadzu Nexera UHPLC and a Shim-pack Bio IEX column (4.6 mm x 100 mm, 3 μm).
Experimental
A bevacizumab biosimilar of 5 mg/mL was prepared in Tris buffer. The sample was directly injected and analyzed on Nexera Bio UHPLC with UV detector. The elution was monitored at 280 nm. Relative peak area (%) was used to quantify the charge variants of bevacizumab biosimilar. Tables 1 and 2 show the analytical conditions for salt-gradient and pHgradient IEX, respectively.
Table 1: LC Analytical Conditions of Salt-Gradient IEX
LC System: Nexera-i UHPLC
Column: Shim-pack Bio IEX SP-NP (4.6 mm x 100 mm; 3 μm)
Temperature: Ambient
Mobile Phase A: Water
Mobile Phase B: 1 M NaCl
Mobile Phase C: 40 mM NaH2PO4
Mobile Phase D: 50 mM Na2HPO4
Gradient: 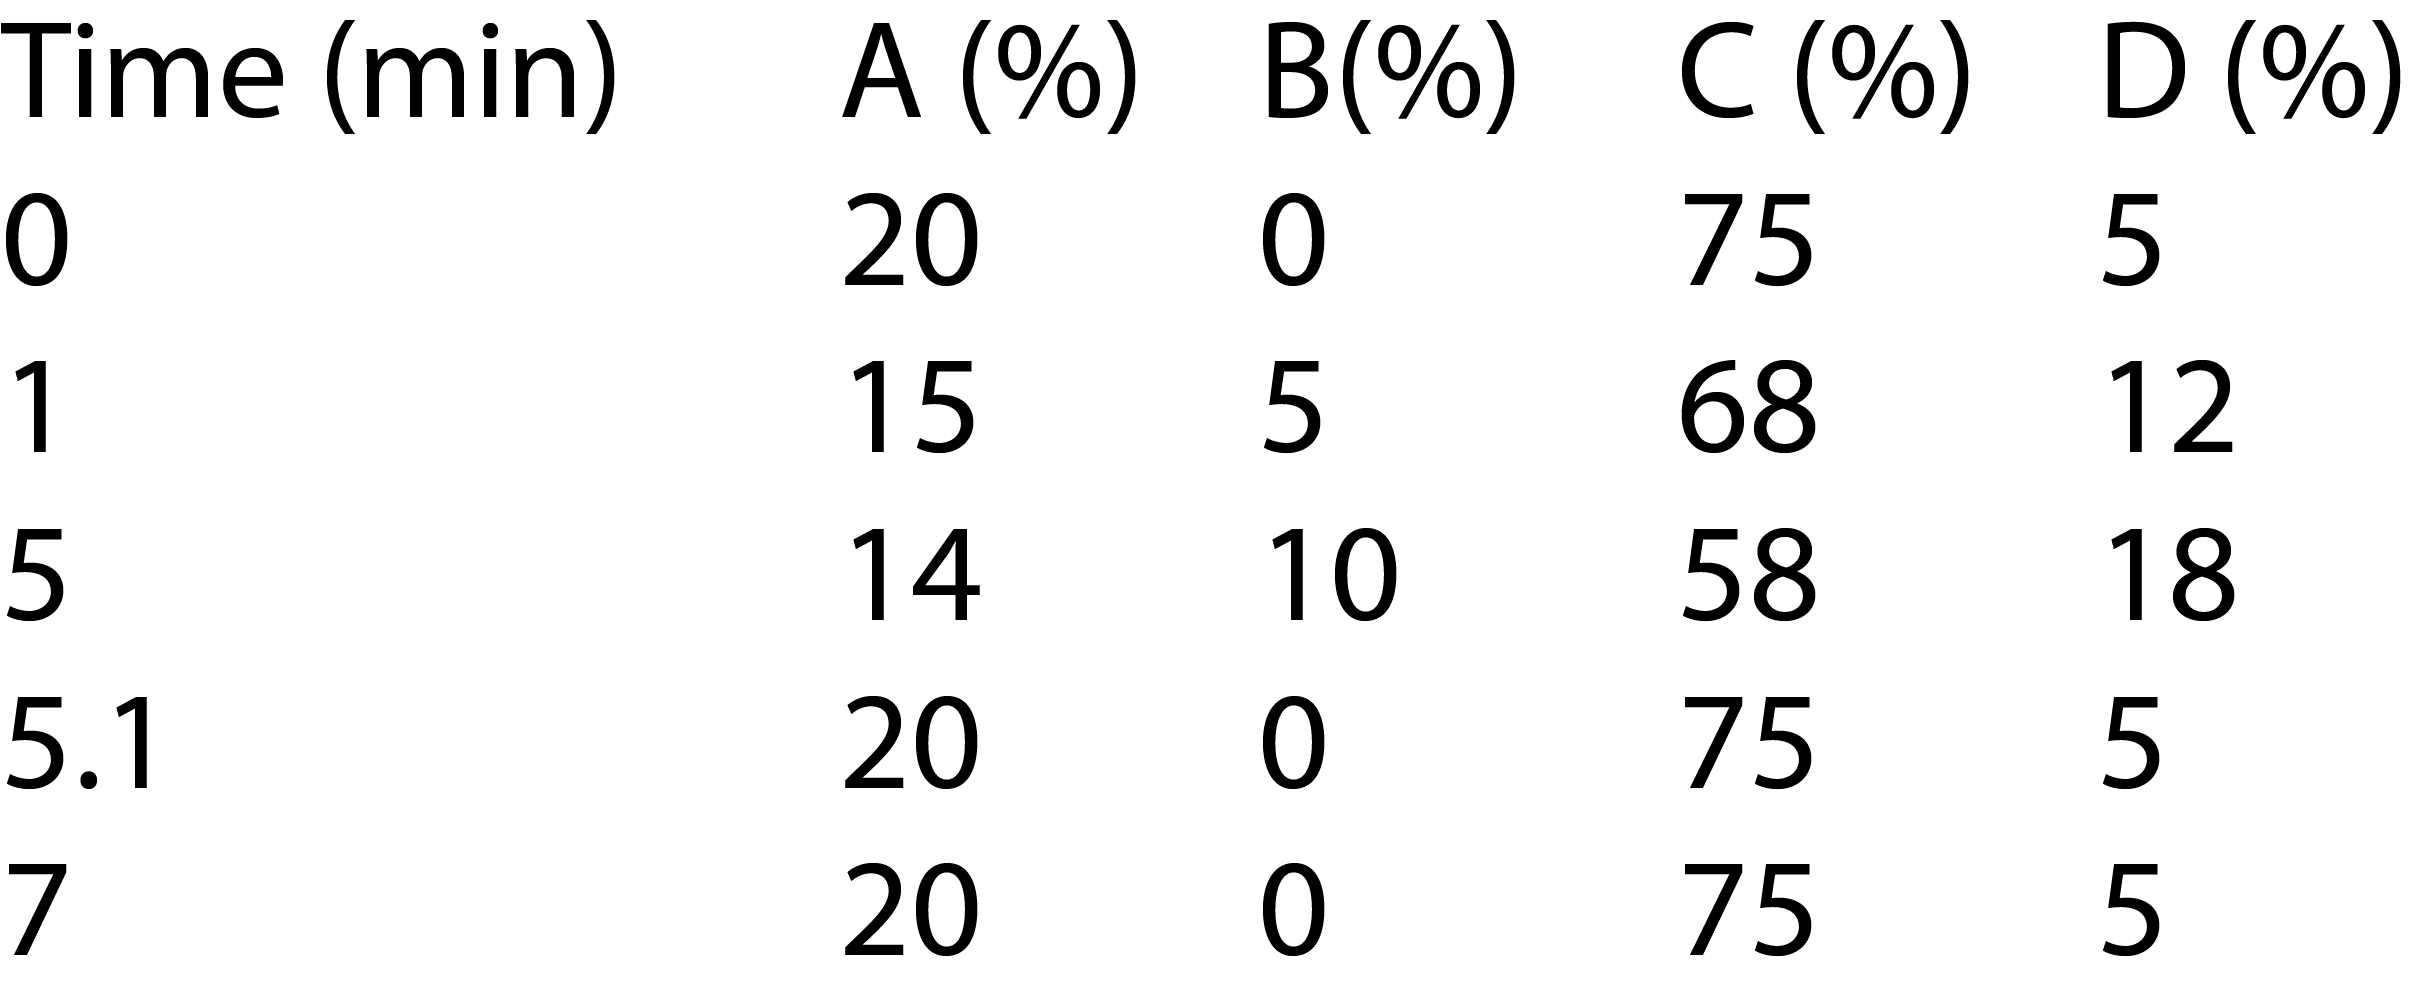
Flow Rate: 0.6 mL/min
Injection Volume: 5µL
Detector: UV, 280 nm
Table 2: LC analytical conditions of pH-gradient IEX
LC System: Nexera Bio UHPLC
Column: Shim-pack Bio IEX SP-NP (4.6 mm x 100 mm; 3 μm)
Temperature: Ambient
Mobile Phase A: 10 mM sodium phosphate buffer, pH 6.0
Mobile Phase B: 10 mM sodium bicarbonate buffer, pH 10.0
Gradient: 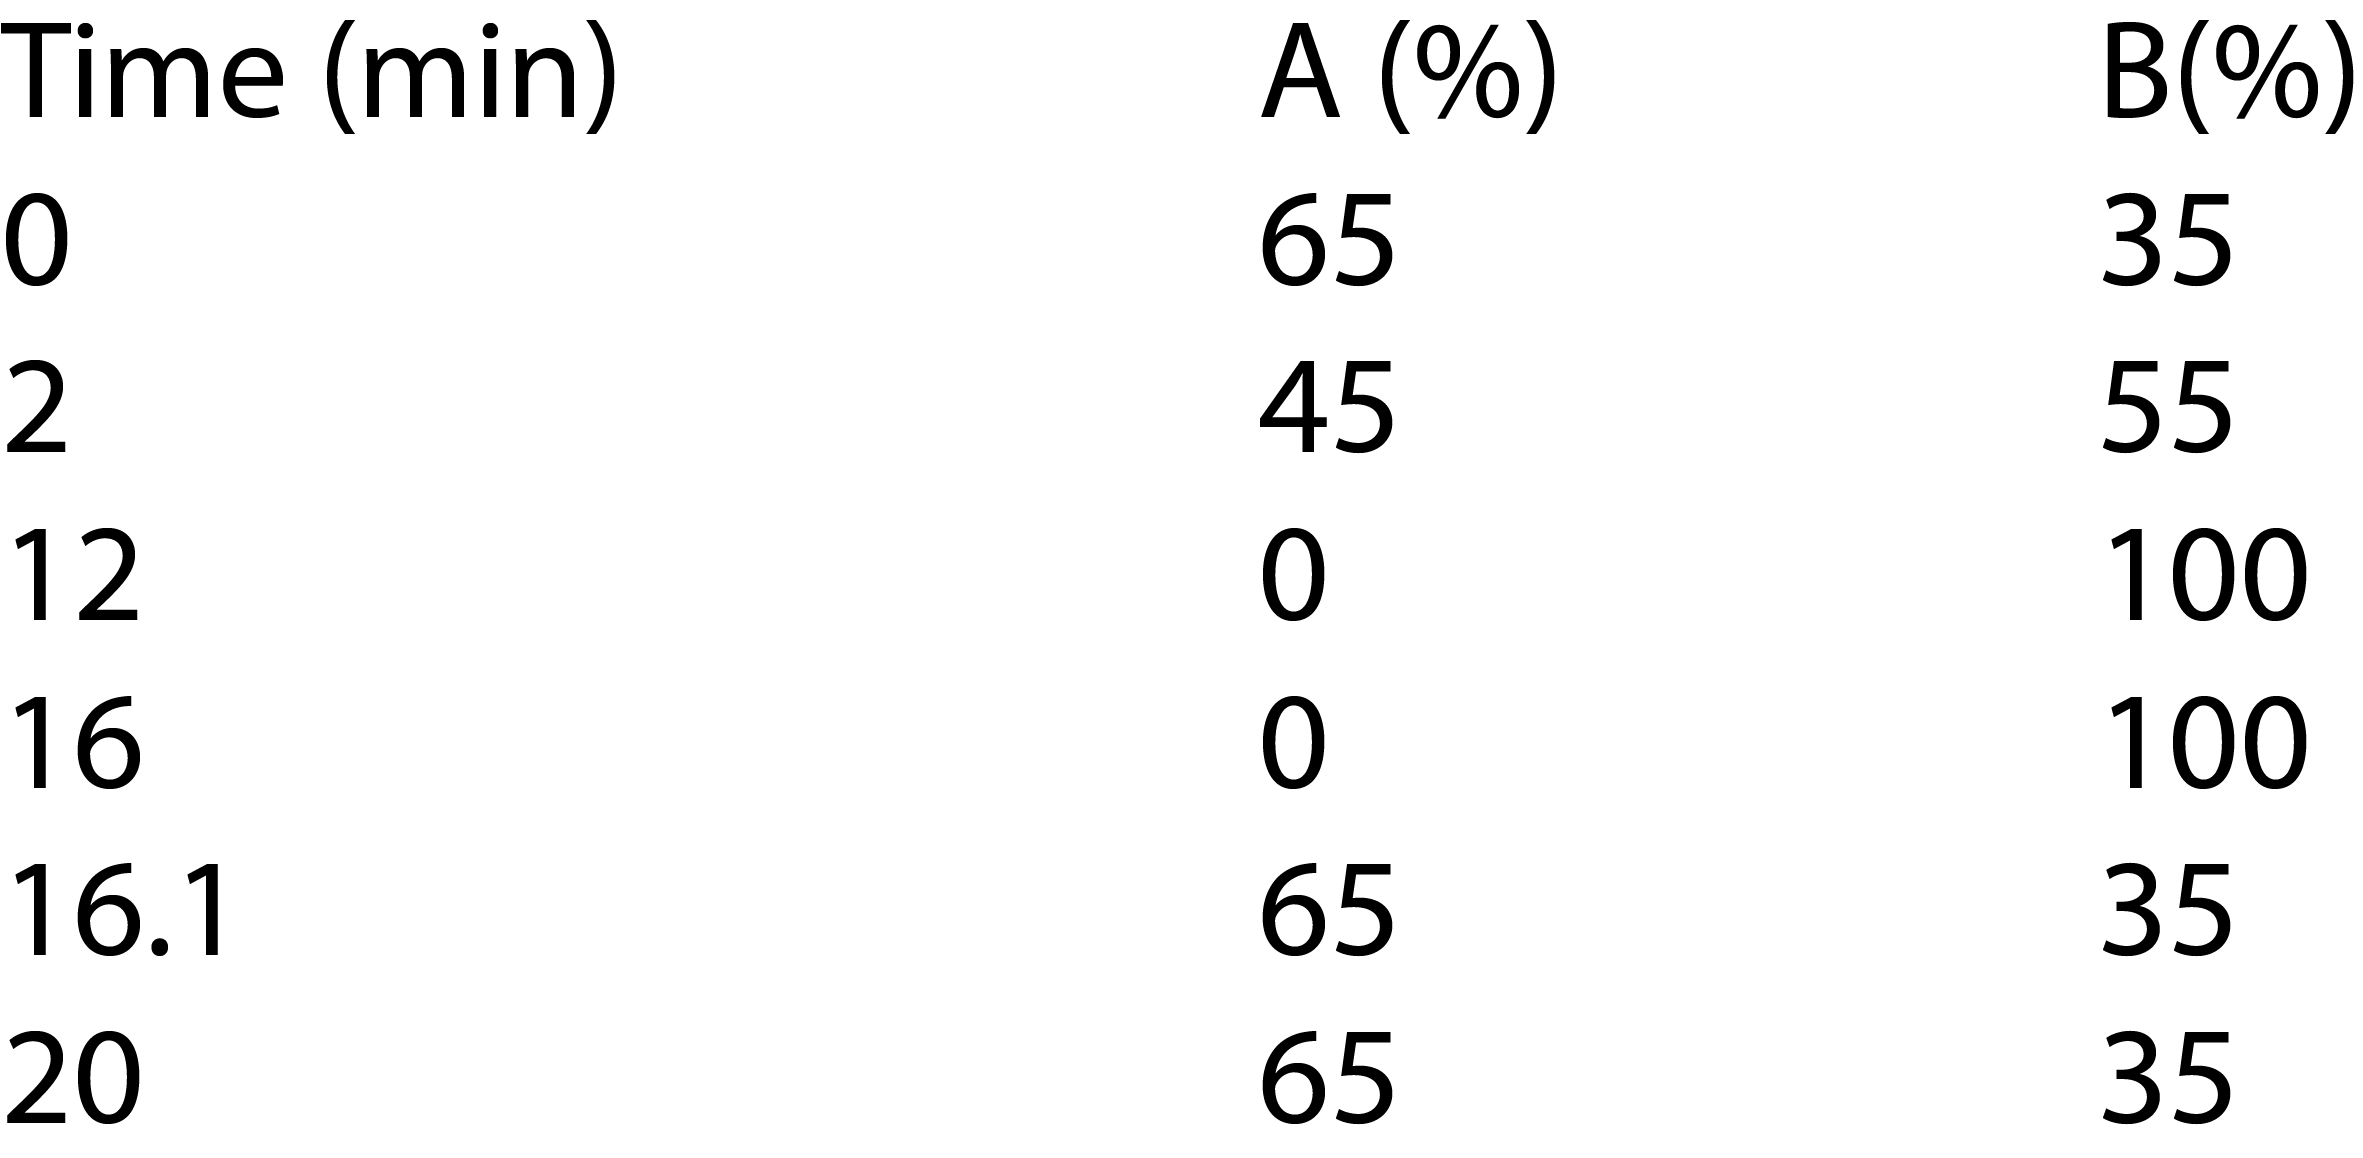
Flow Rate: 0.6 mL/min
Injection Volume: 5µL
Detector: UV, 280 nm
Result and Discussion
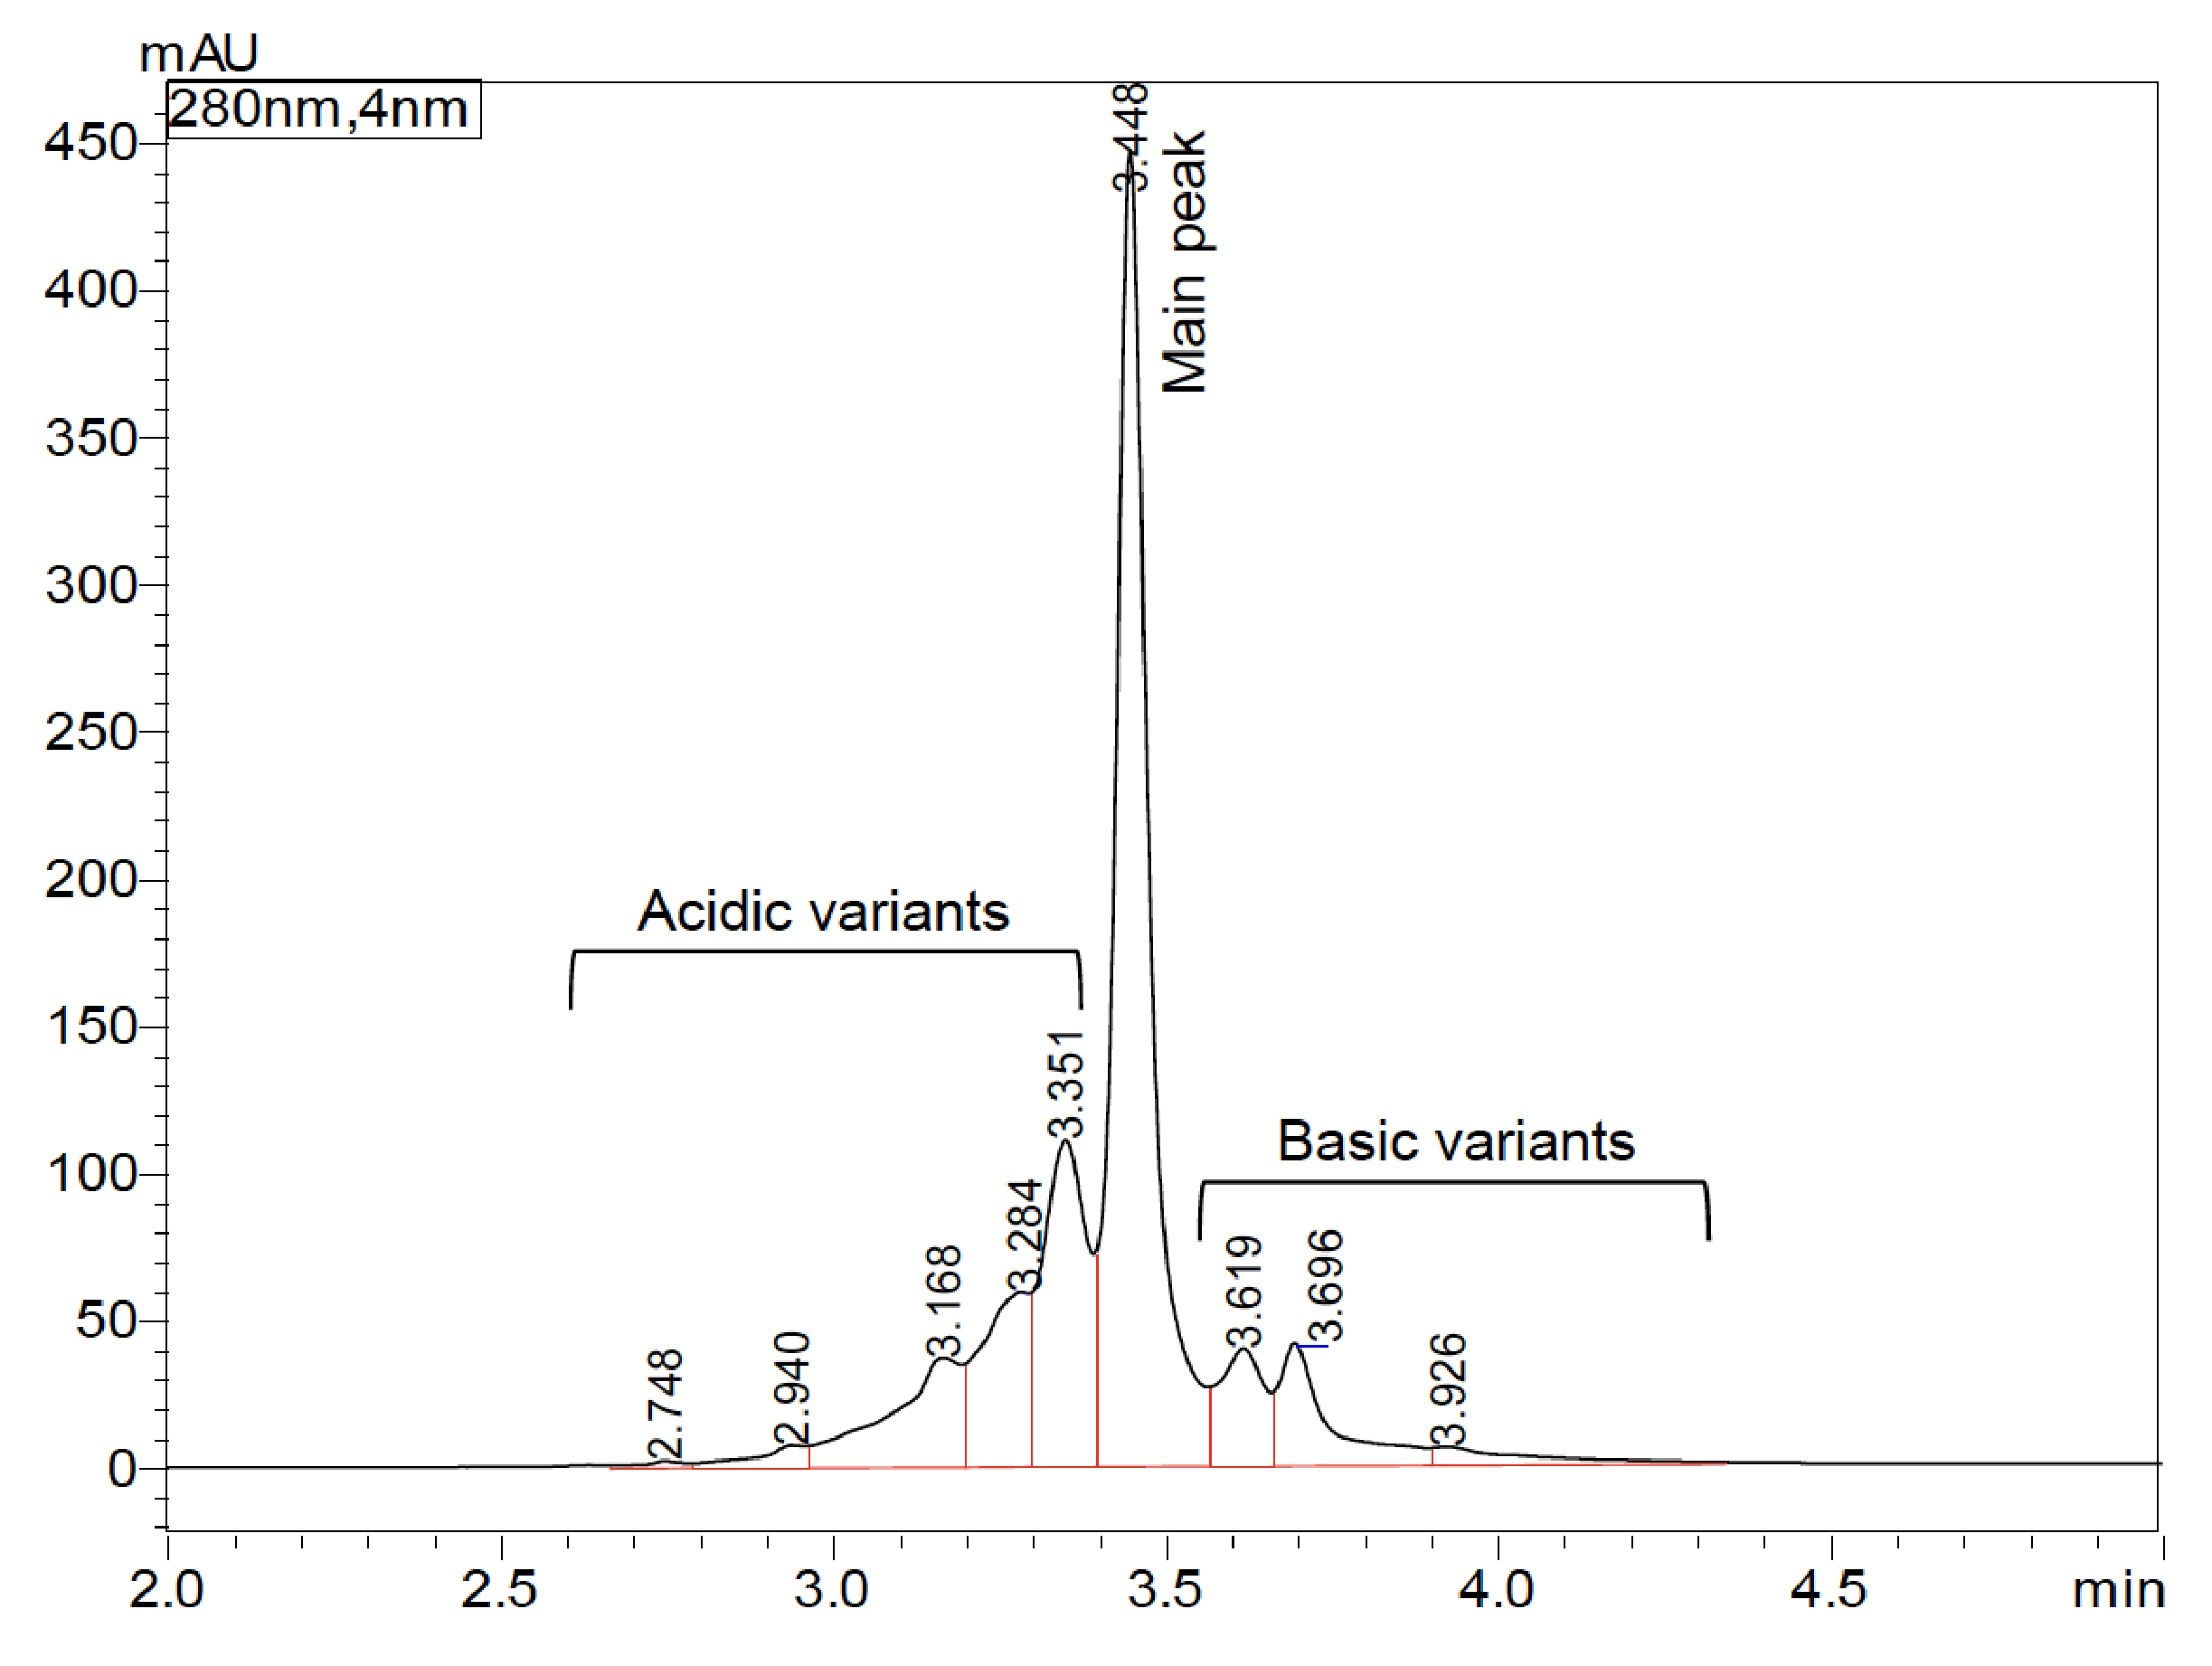
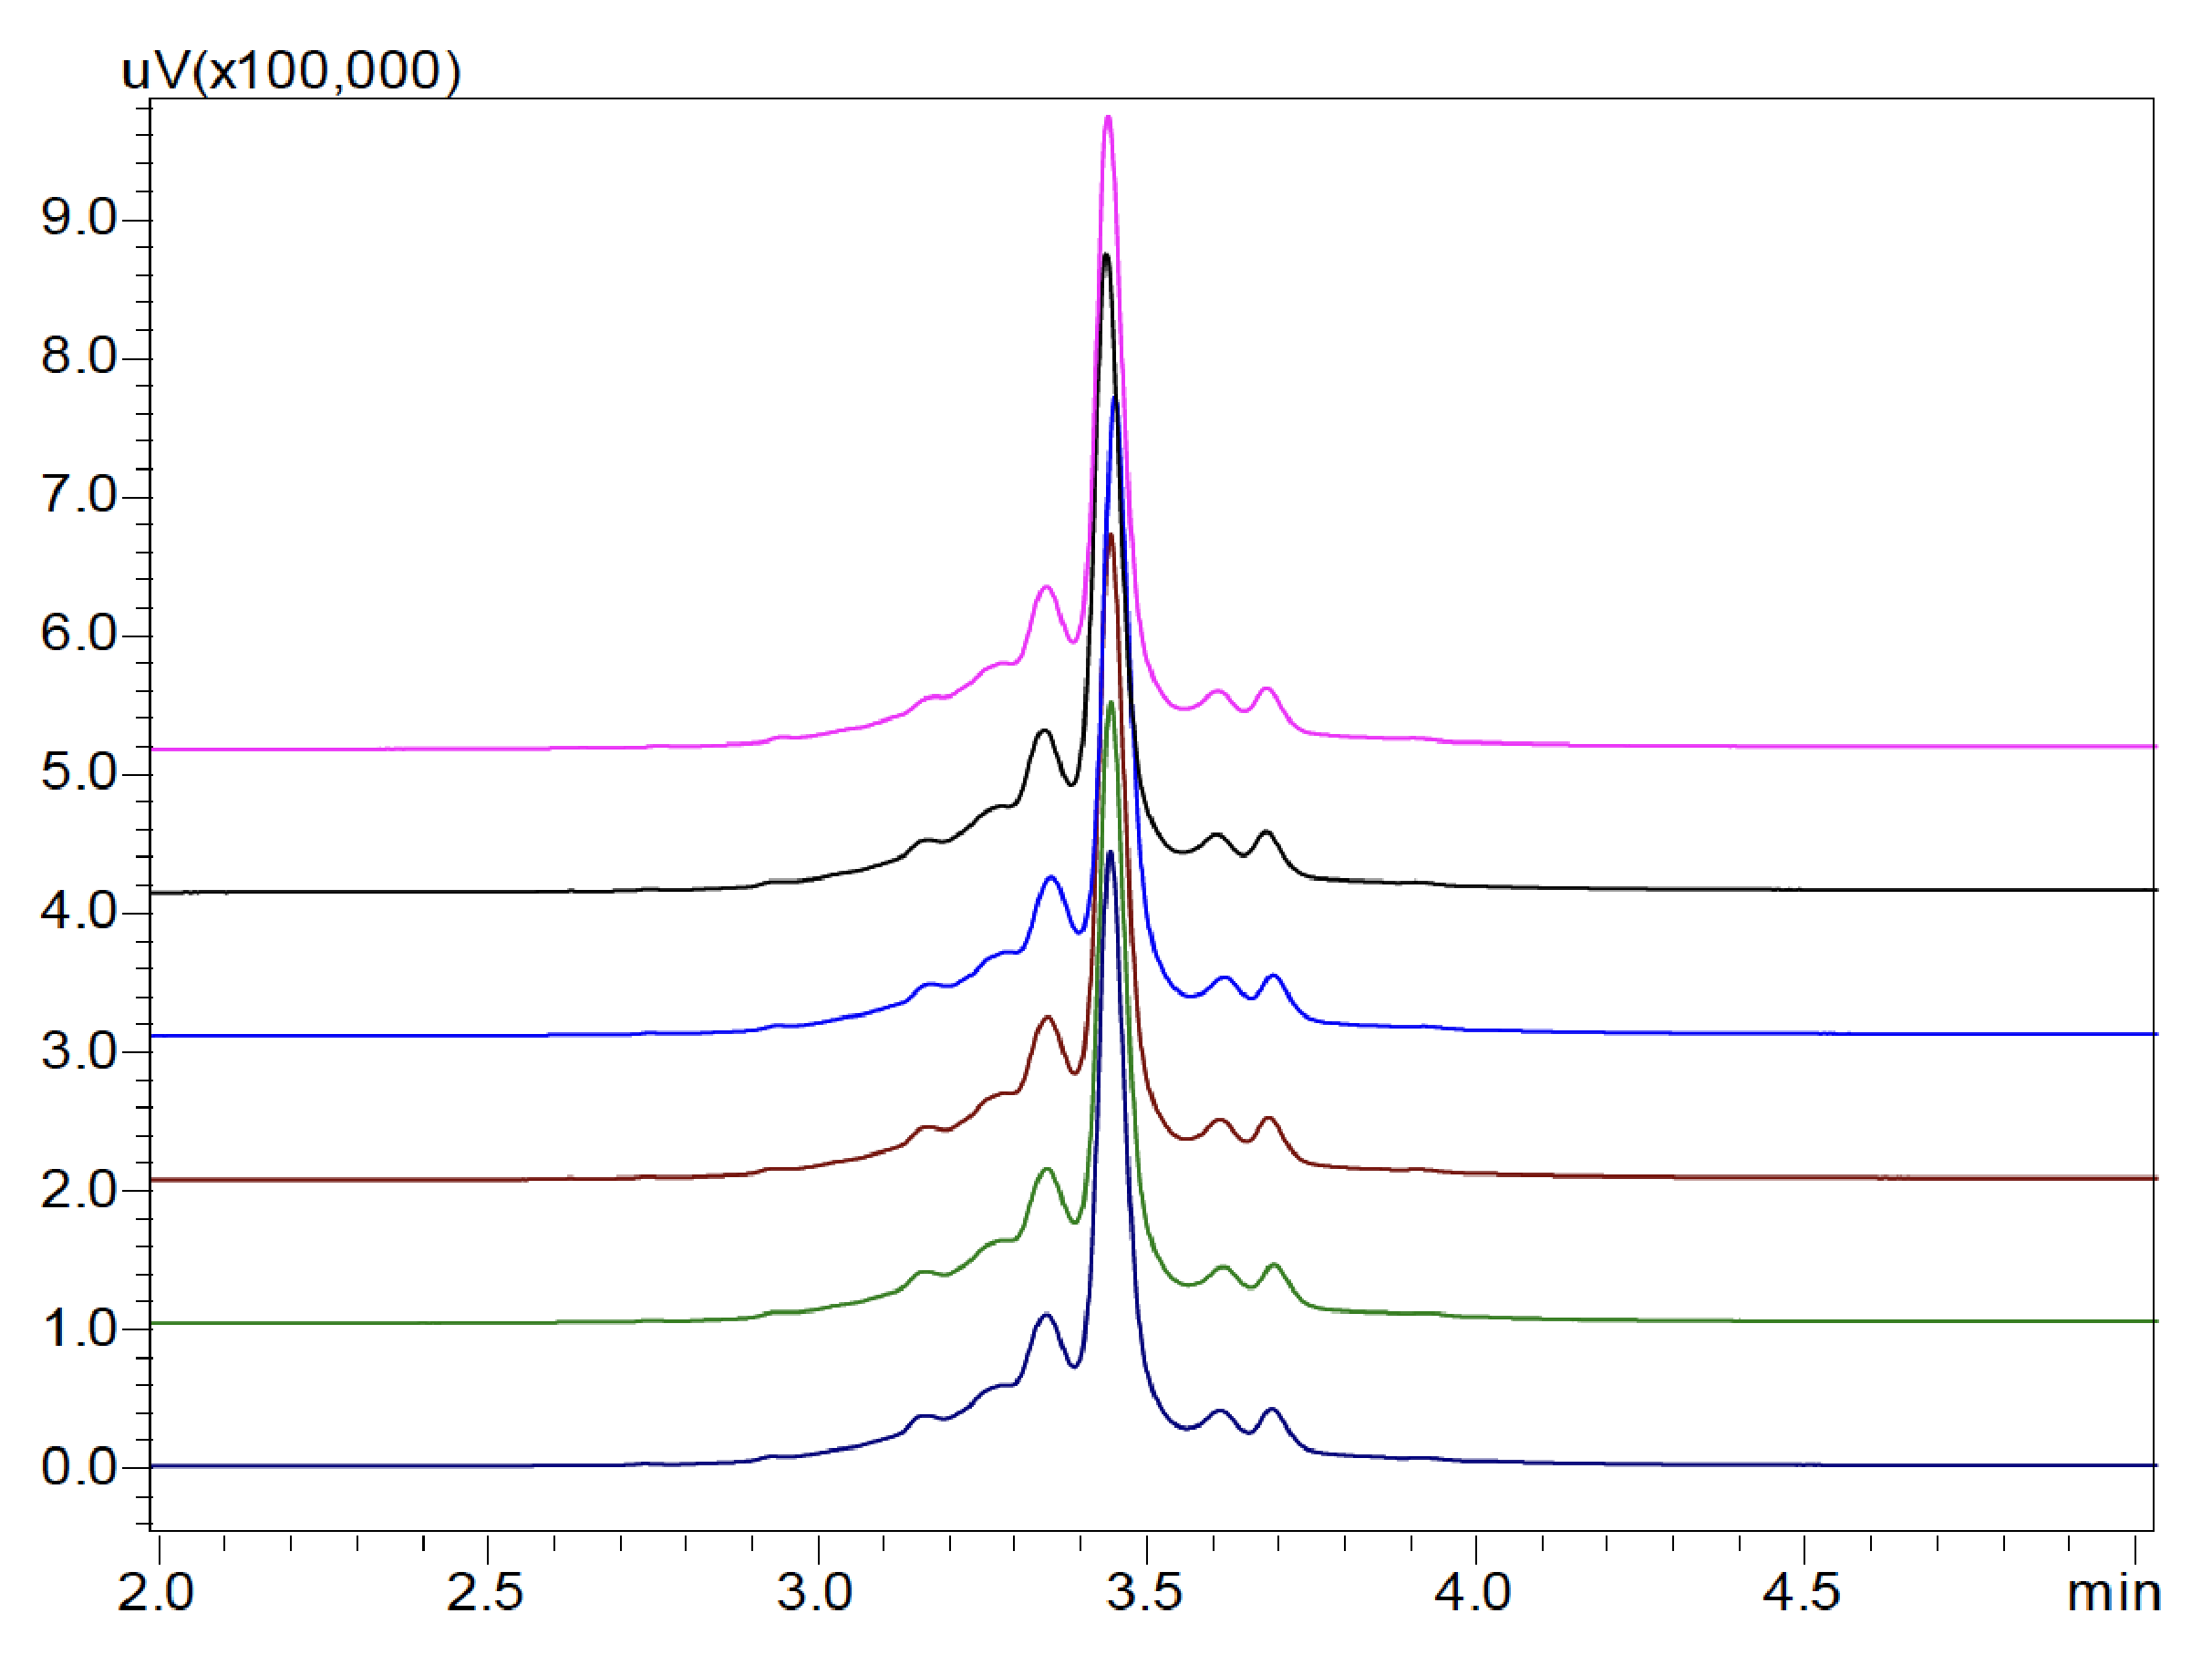
In this study, both salt-gradient and pH-gradient IEX methods were carried out for optimal bevacizumab biosimilar charge variant analysis. Figure 1 shows the charge variant profile of bevacizumab biosimilar on a Shim-pack Bio IEX column with a salt-gradient elution program, demonstrating high-resolution separation of charge variants in 5 minutes. The peak at 3.448 min was designed as the main peak. The early and late-eluting peaks were called acidic variants and basic variants, respectively. The relative peak area percent of charge variants of bevacizumab biosimilar based on six consecutive analyses is summarized in Table 3. The main peak was found to be around 50.99%. The acidic variants and basic variants were 34.94% and 14.07%, respectively. Also, injection-to-injection variability of the UHPLC-UV system was evaluated based on the six consecutive analyses. As shown in Figure 3, the overlay of six replicates indicates an excellent separation reproducibility. Variations in retention time of six injections were <1% RSD for all the peaks (data not shown). Variations in peak area of six injections were <2% RSD for the main peak as well as acidic and basic variants (Table 3).
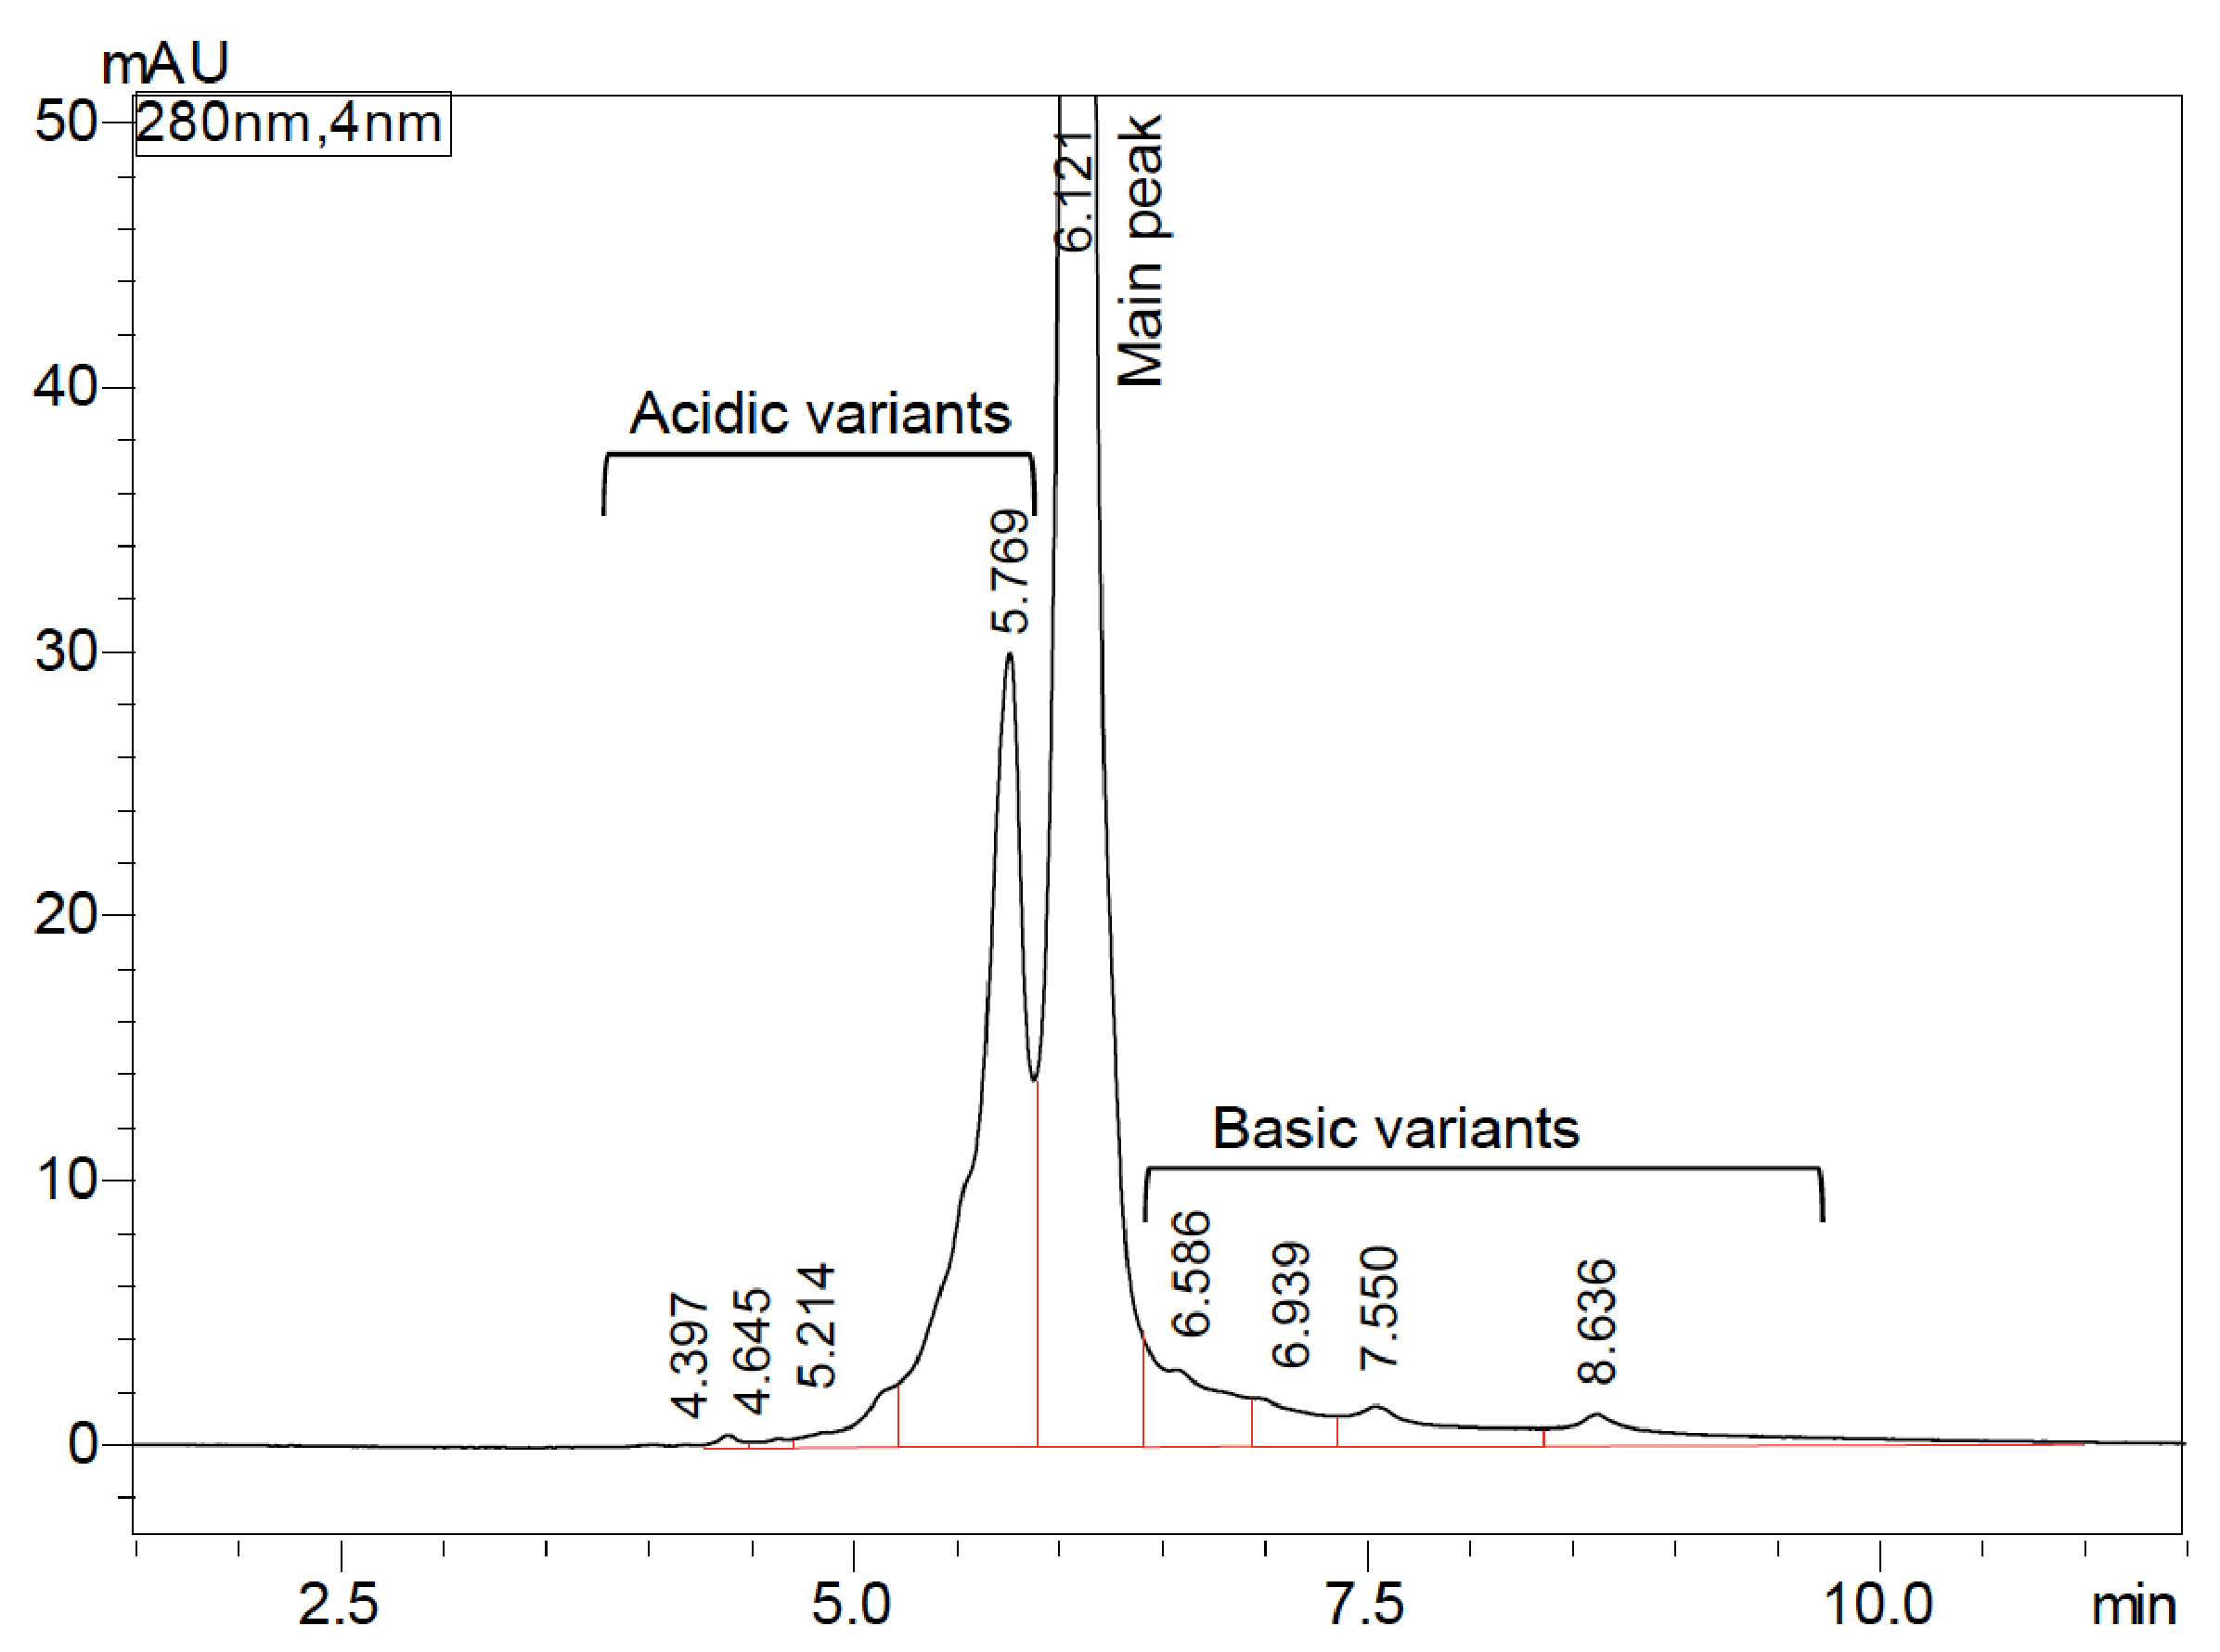
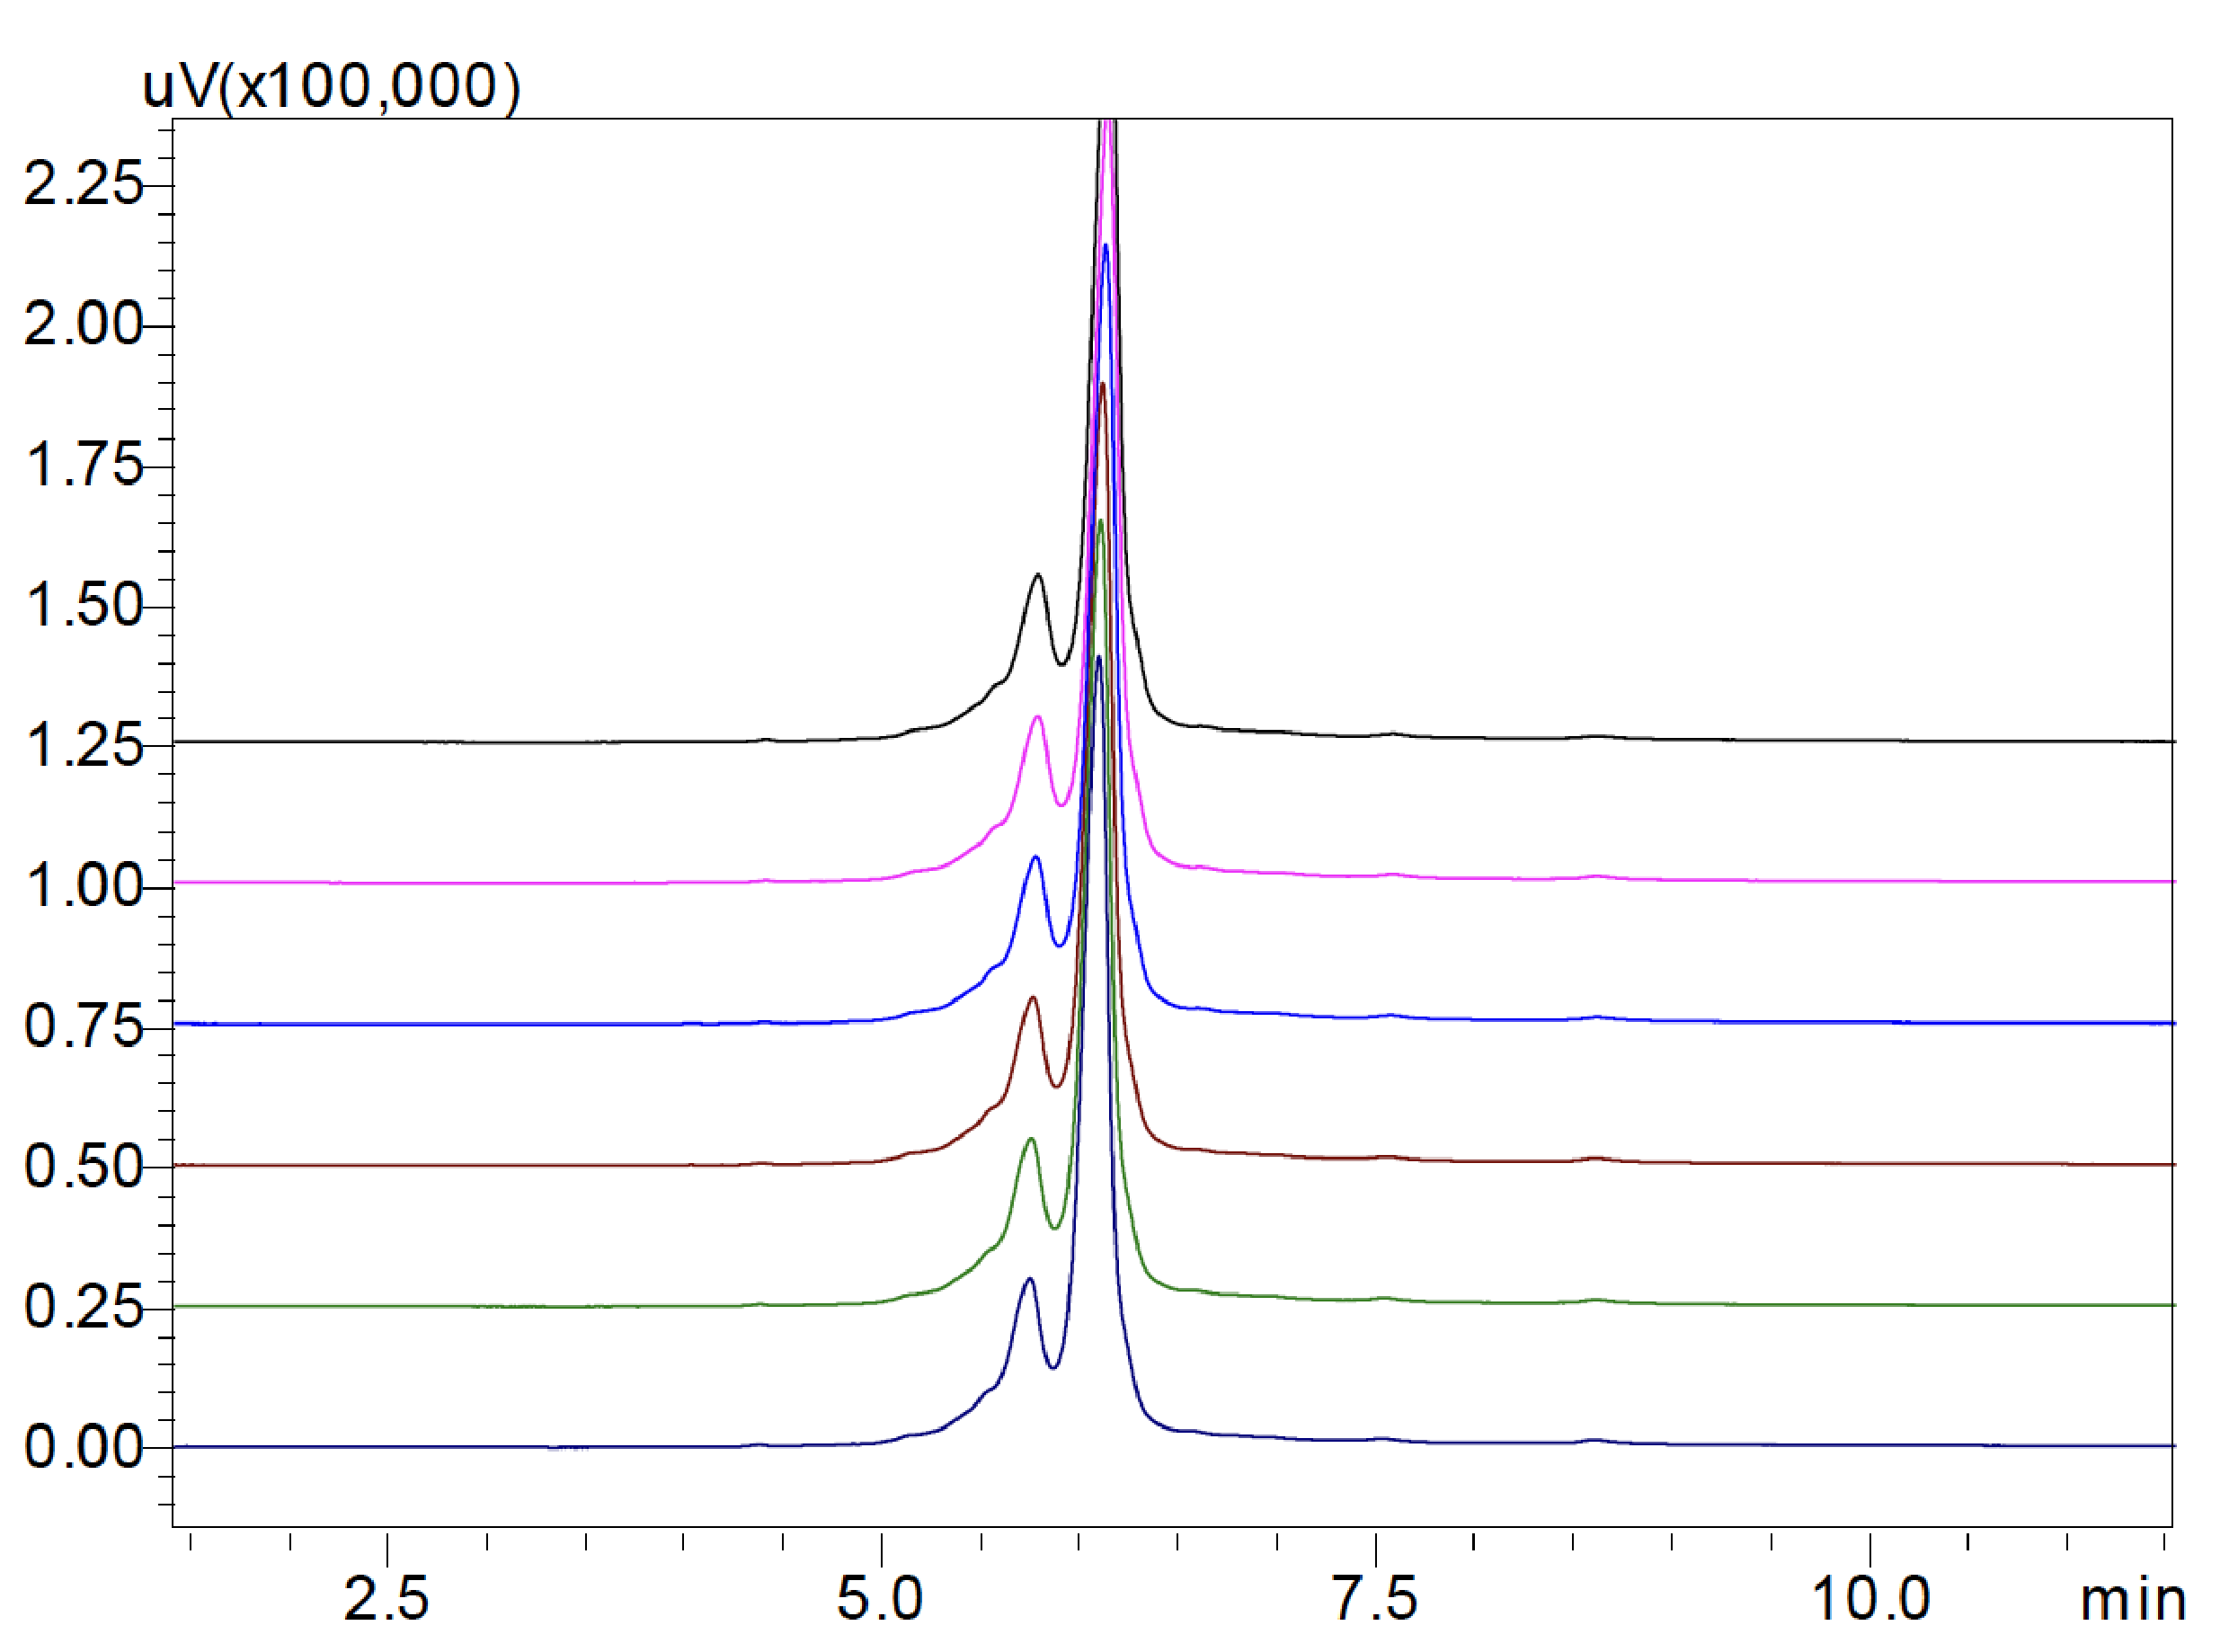
The charge variant profile of bevacizumab biosimilar on a Shim-pack Bio IEX column with a pH-gradient elution program is shown in the Figure 3, indicating an excellent separation of charge variants in 12 minutes. The peak at 6.121 min was designed as the main peak. Early and late-eluting peaks were defined as acidic variants and basic variants, respectively. Table 4 shows the peak area percent of charge variants of bevacizumab biosimilar based on six consecutive analyses. The main peak was found to be 67.30%. Acidic variants and basic variants were 23.25% and 9.45%, respectively. Moreover, injection-to-injection variability of UHPLC-UV system was evaluated in Figure 4. The variations in retention time of six injections were <1% RSD for all the peaks (data not shown). Variations in peak area of six injections were <2% RSD for the main peak as well as acidic and basic variants (Table 4).
| Acidic variants a | Main peak | Basic variants b | Total | ||||
| Area | Area (%) | Area | Area (%) | Area | Area (%) | ||
| Injection _1 | 1,092,232 | 34.77 | 1,606,848 | 51.15 | 442,237 | 14.08 | |
| Injection _2 | 1,108,765 | 34.95 | 1,619,310 | 51.05 | 444,149 | 14.00 | |
| Injection _3 | 1,149,156 | 35.00 | 1,673,033 | 50.96 | 460,888 | 14.04 | |
| Injection _4 | 1,136,214 | 34.91 | 1,662,777 | 51.09 | 455,419 | 13.99 | |
| Injection _5 | 1,139,549 | 35.05 | 1,651,223 | 50.79 | 460,176 | 14.16 | |
| Injection _6 | 1,125,892 | 34.92 | 1,642,164 | 50.93 | 456,312 | 14.15 | |
| Average | 34.94 | 50.99 | 14.07 | 100% | |||
| %RSD | 1.89 | 1.55 | 1.78 | ||||
Table 3: Injection-to-injection repeatability of peak area (n = 6) of charge variants of bevacizumab biosimilar using salt-gradient
aAcidic variants is a sum area of peaks at 2.748, 2.940, 3.168, 3.284, 3.351 minutes
bBasic variants is a sum area of peaks at 3.619. 3.696, 3.926 minutes
| Acidic variants | Main peak | Basic variants | Total | ||||
| Area | Area (%) | Area | Area (%) | Area | Area (%) | ||
| Injection _1 | 517,010 | 23.26 | 1,495,411 | 67.29 | 210,035 | 9.45 | |
| Injection _2 | 524,489 | 23.71 | 1,480,774 | 66.94 | 206,779 | 9.35 | |
| Injection _3 | 519,527 | 23.42 | 1,490,580 | 67.21 | 207,808 | 9.37 | |
| Injection _4 | 506,853 | 22.91 | 1,498,276 | 67.73 | 207,115 | 9.36 | |
| Injection _5 | 524,504 | 23.55 | 1,486,008 | 66.73 | 216,506 | 9.72 | |
| Injection _6 | 498,975 | 22.65 | 1,495,740 | 67.88 | 208,671 | 9.47 | |
| Average | 23.25 | 67.30 | 9.45 | 100% | |||
| %RSD | 1.99 | 0.45 | 1.73 | ||||
Table 4: Injection-to-injection repeatability of peak area (n = 6) of charge variants of bevacizumab biosimilar using pH-gradient
aAcidic variants is a sum area of peaks at 4.397, 4.645, 5.214, 5.769 minutes
bBasic variants is a sum area of peaks at 6.586, 6.939, 7.550, 8.636 minutes
By comparing the two gradient methods, it was found that the results of relative peak area percent of charge variants of bevacizumab biosimilar are slightly different mainly because the peaks are not fully separated, yet both results showed that the main peak is the major one with >50% of the total peak area, and followed by acidic and basic variants. In addition, the variations might be caused by the different elution programs used here: in the saltgradient elution, the Na+ outcompetes the mAb on ionexchange sites and the mAb begins to elute with increasing salt; in the pH-gradient elution, when the net charge of the mAb becomes neutral at its isoelectric point the mAb begins to elute with increasing pH.
Conclusions
Although giving different results on the relative peak area percent for charge variants of bevacizumab biosimilar, both salt-gradient and pH-gradient IEX methods described in current study demonstrate high-resolution separation of charge variants of mAb. More importantly, both methods were validated for stability and repeatability in retention time and peak area with RSDs <2%, demonstrating the precision of the system. In conclusion, both salt-gradient and pH-gradient work equally.
Reference
Farnan D, Moreno GT. Multiproduct high-resolution monoclonal antibody charge variant separations by pH gradient ion-exchange chromatography. Anal Chem. 2009, 81(21):8846-57.
