Introduction
Monoclonal antibodies (mAbs) are a major class of biopharmaceuticals due to its wide application in medicine and biological science. The antibody’s biological activity can be attributed to its unique structural conformation [1]. Protein higher order structure (HOS) includes the secondary, tertiary and quaternary structures of protein, which comprise the three dimensional structures of protein [2]. Analysis of the HOS of mAbs is essential to ensure the quality and efficacy of the protein therapeutics product. Some analytical methods that have been used to characterize protein HOS include UV circular dichroism, nuclear magnetic resonance (NMR) and fourier transform infrared (FTIR) spectroscopy.
FTIR spectroscopy is suitable to determine the relative amount of different secondary structure of proteins. This information can be obtained from the amide band I of protein in the IR spectrum, ranging from 1600 cm-1 to 1700 cm-1. Mathematical procedures such as band curve-fitting and second derivatives can be applied to resolve the overlapping amide I band components and quantify the secondary structure of proteins. In this application news, the secondary structure of mAbs is examined by using FTIR spectroscopy and band curve-fitting data analysis.
Experimental
The mAbs used in this analysis are bevacizumab biosimilar and trastuzumab. Both bevacizumab biosimilar and trastuzumab were prepared and diluted to 25 mg/mL and 30 mg/mL respectively using deionized water.
For FTIR measurement, the MicromATR ATR accessory (Figure 1), equipped with a 9 reflection ATR crystal (diamond) was used. In comparison to the transmission cell technique used in the application news AD-0178 [3], the small crystal surface area of the ATR only requires 30 μL sample and is easier to clean. The 9 reflection ATR crystal has better sensitivity as compared with a single reflection crystal.
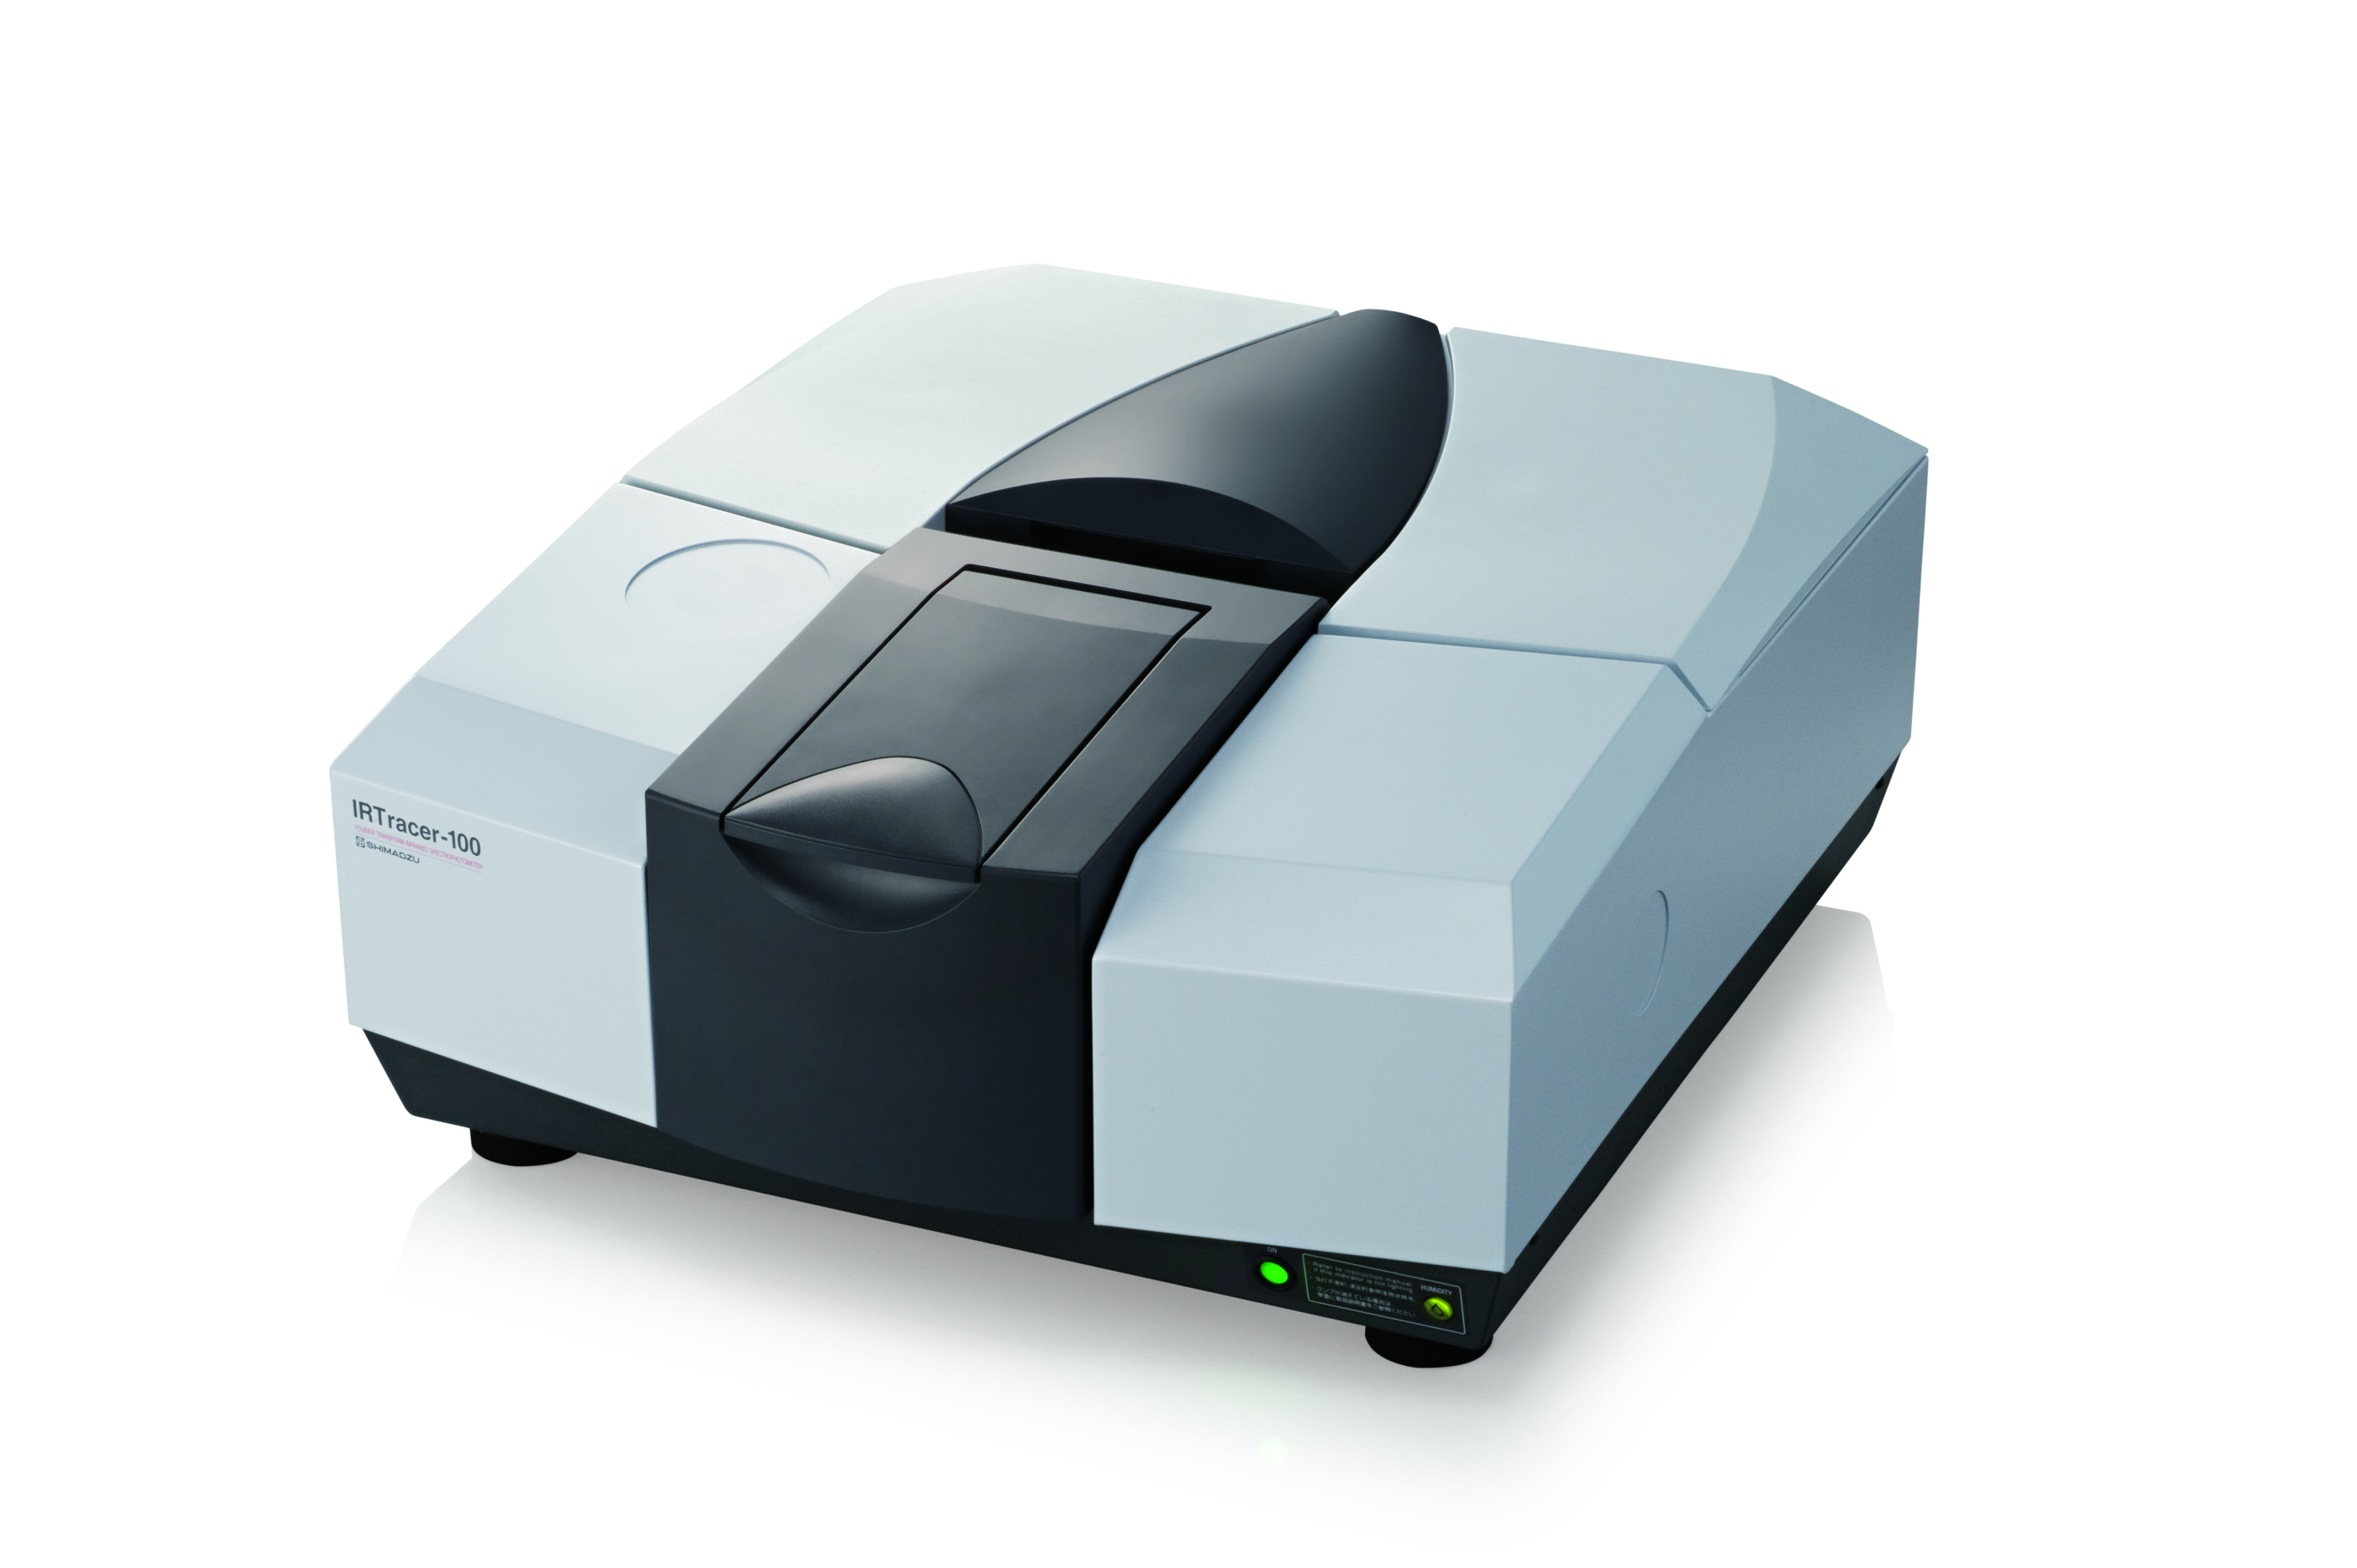
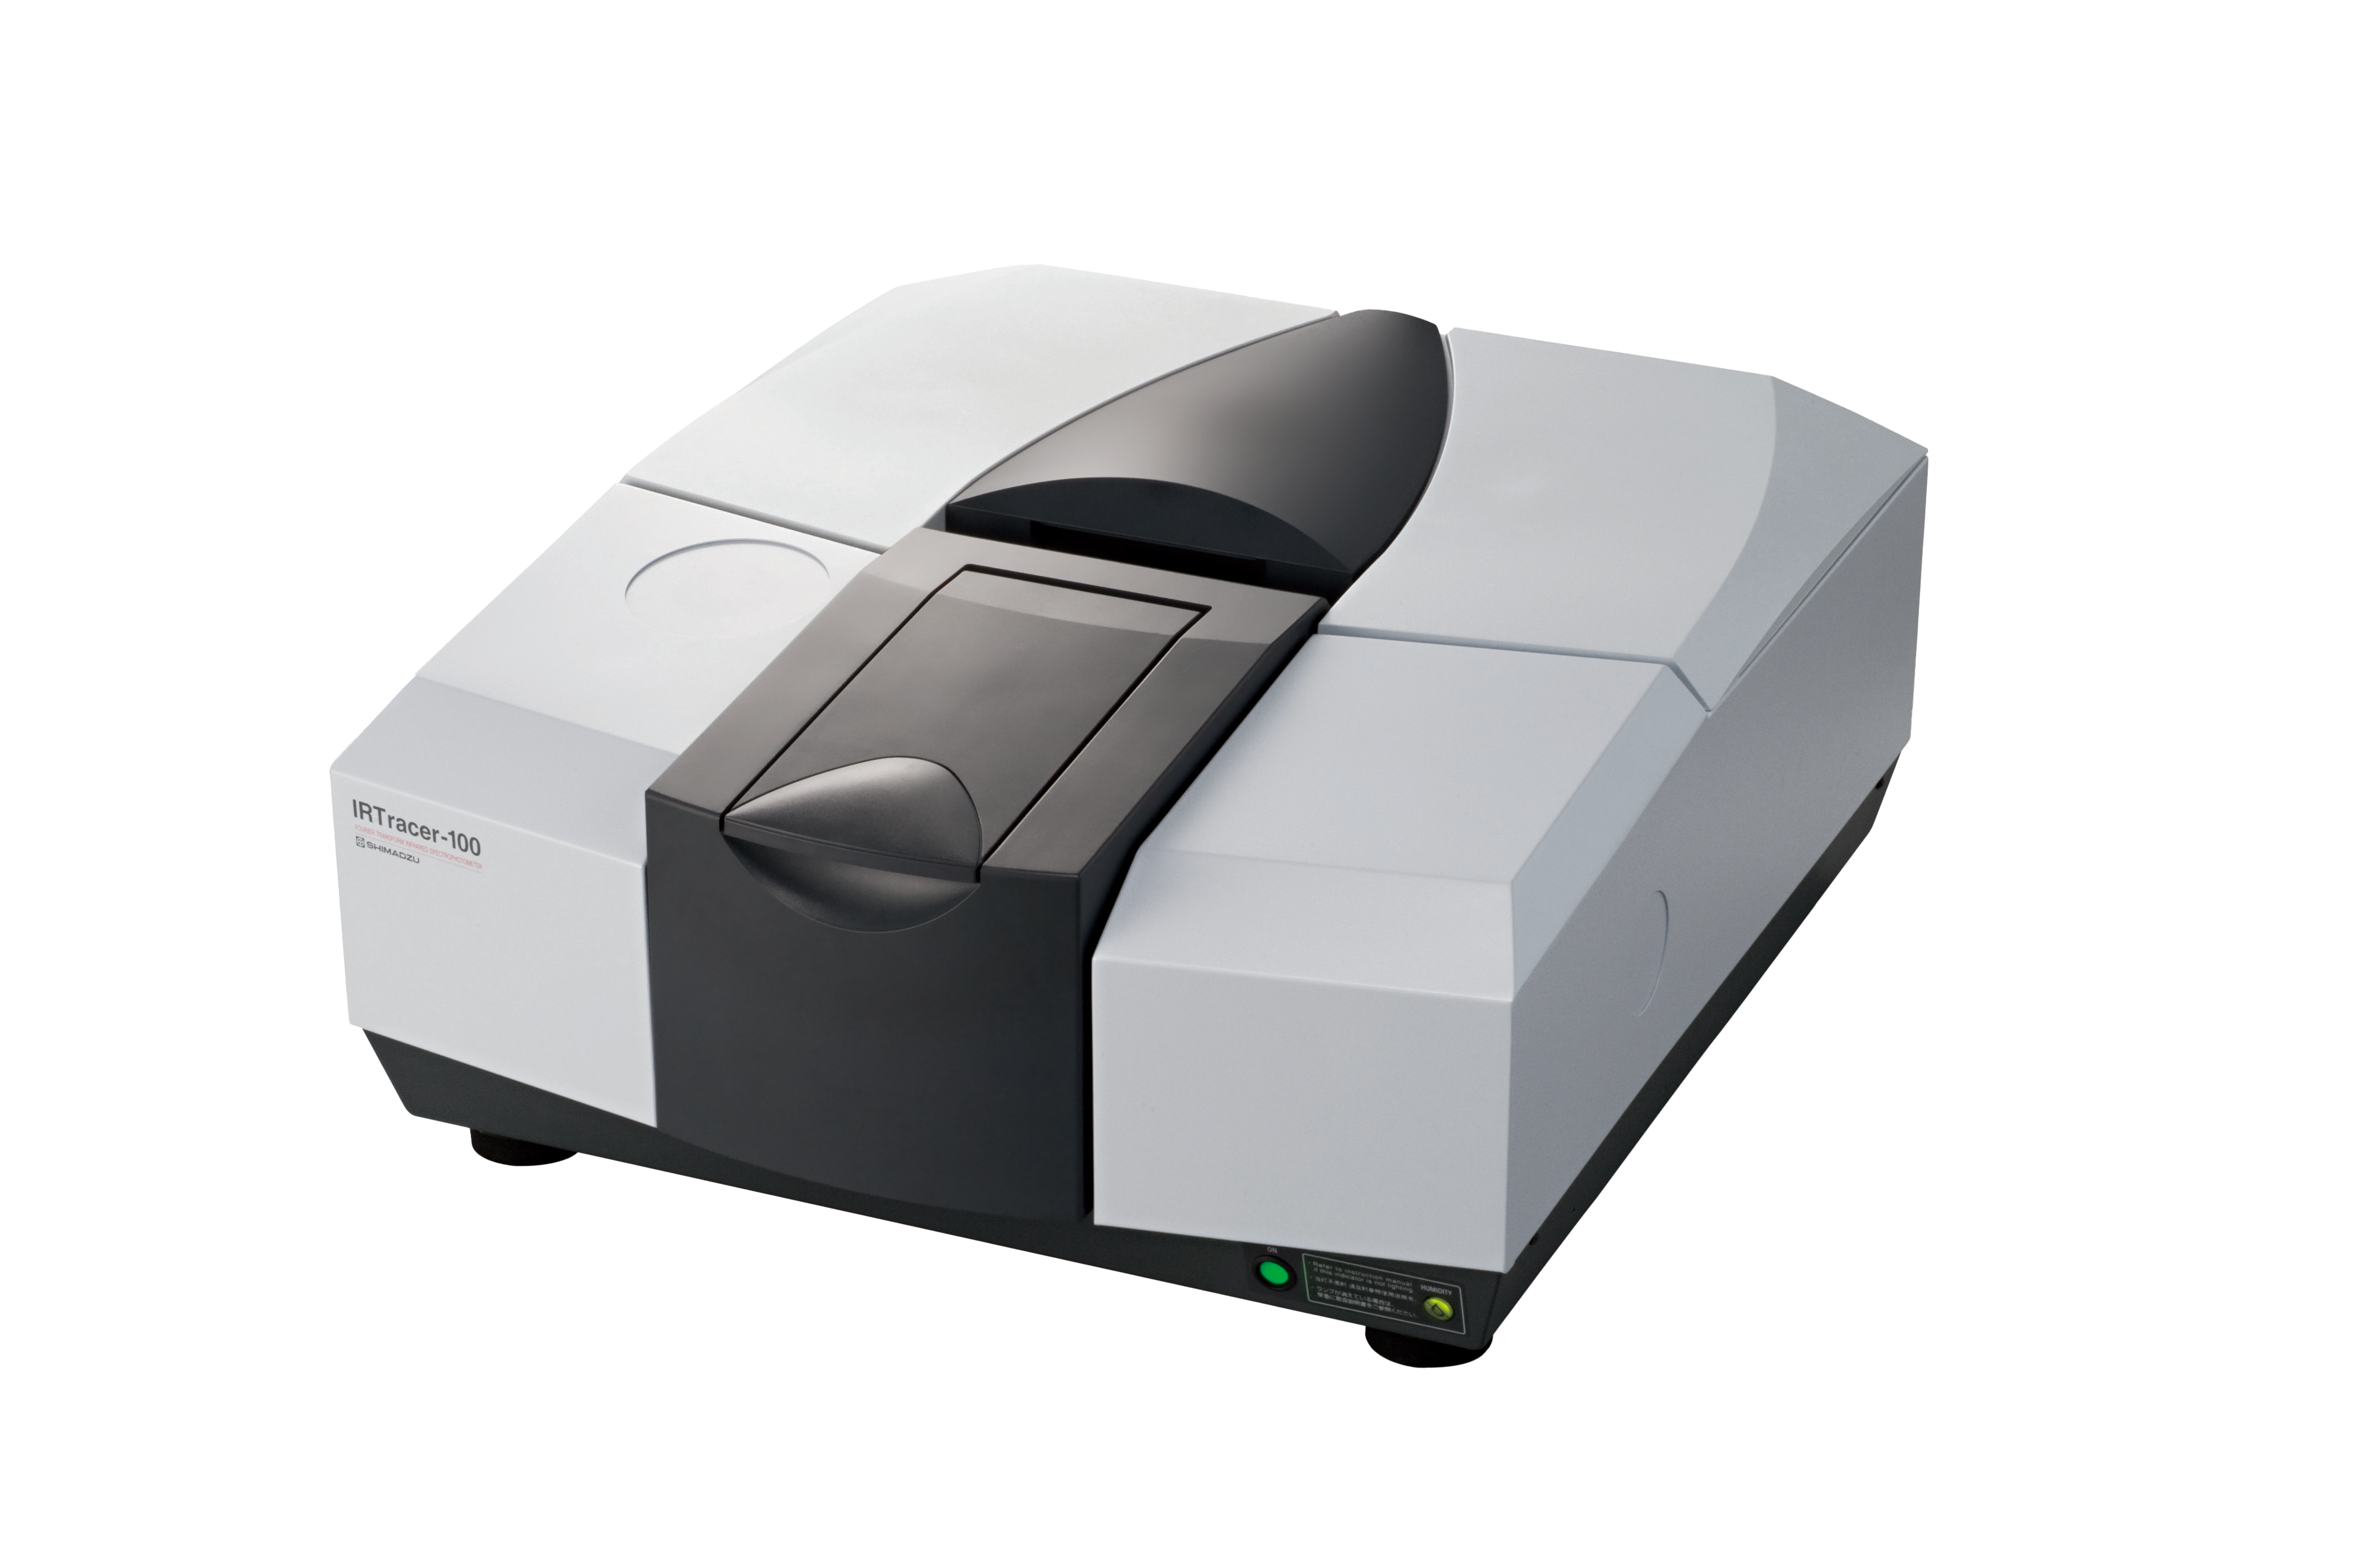
Deionized water, which is a reference blank, was pipetted onto the crystal surface. Infrared spectrum was obtained using Shimadzu IRTracer-100 FTIR spectrometer and the measurement conditions are shown in Table 1. The IR spectra were acquired in the wavenumber range of 1900 cm-1 to 600 cm-1. The antibody solutions were measured with the same procedure and each sample was measured four times.
Table 1 Instrument and Analytical Conditions
Instruments: IRTracer-100 Fourier transform infrared spectrophotometer MicromATR ATR accessory
Resolution: 4 cm-1
Accumulation: 100 times
Apodization Function: Sqr-Traiangle
Detector: DLTGS

Results and Discussion
The amide I band of antibody protein (1600 cm-1 to 1700 cm-1) overlapped directly with the water vibration mode (1640 cm-1). To obtain the antibody true spectra, the antibody spectrum was subtracted with the reference blank spectrum. To ensure there is no over- or under-subtraction of the reference blank spectrum, the wavenumber range 1900 cm-1 to 1700 cm-1 should be a flat baseline without a negative lobe in the range. Figure 2 shows the overlay IR spectra of antibody samples after subtraction.
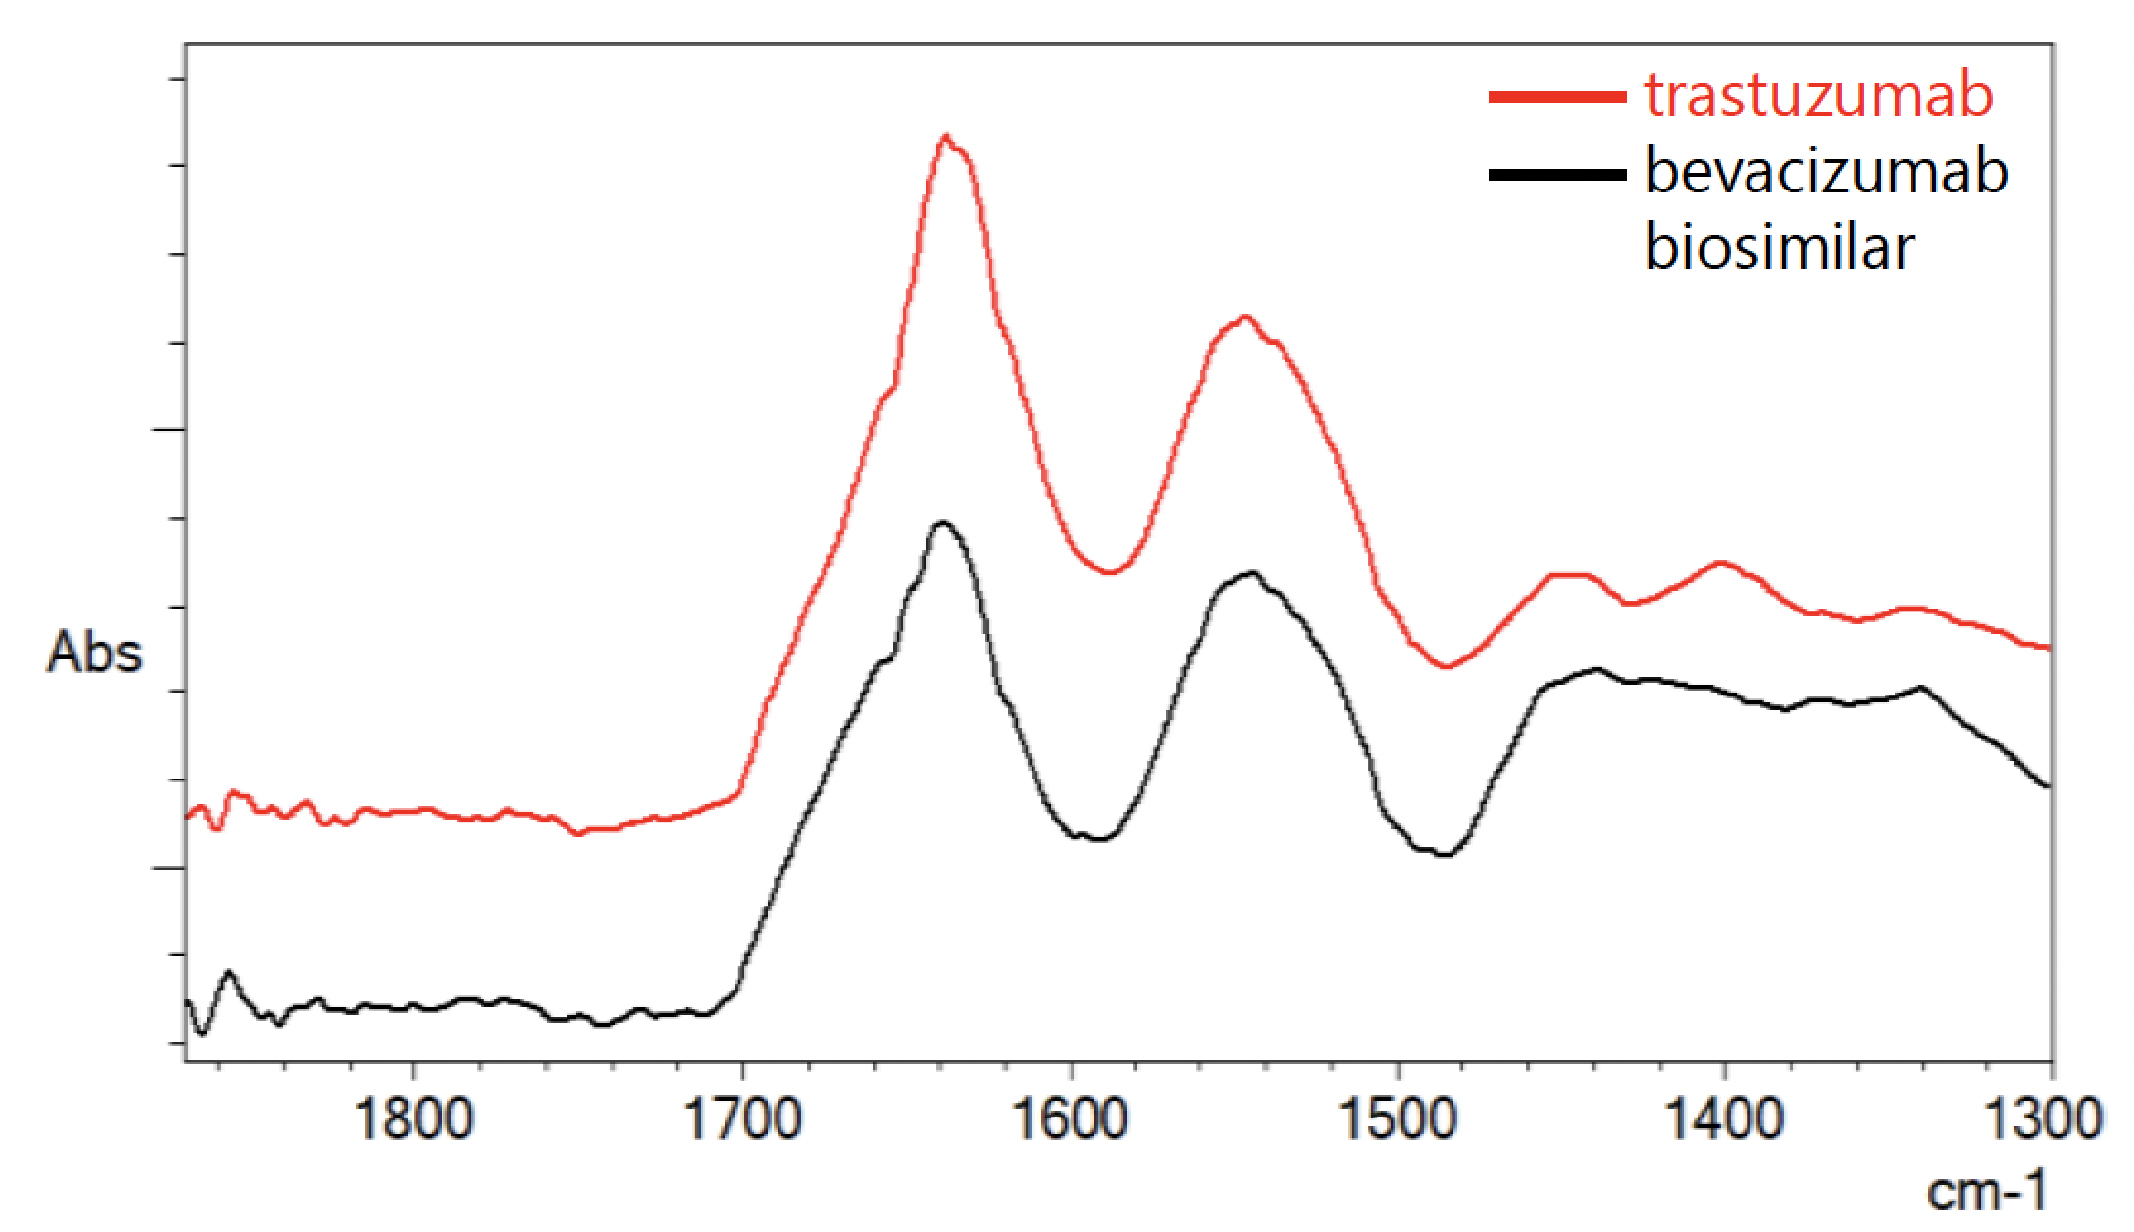
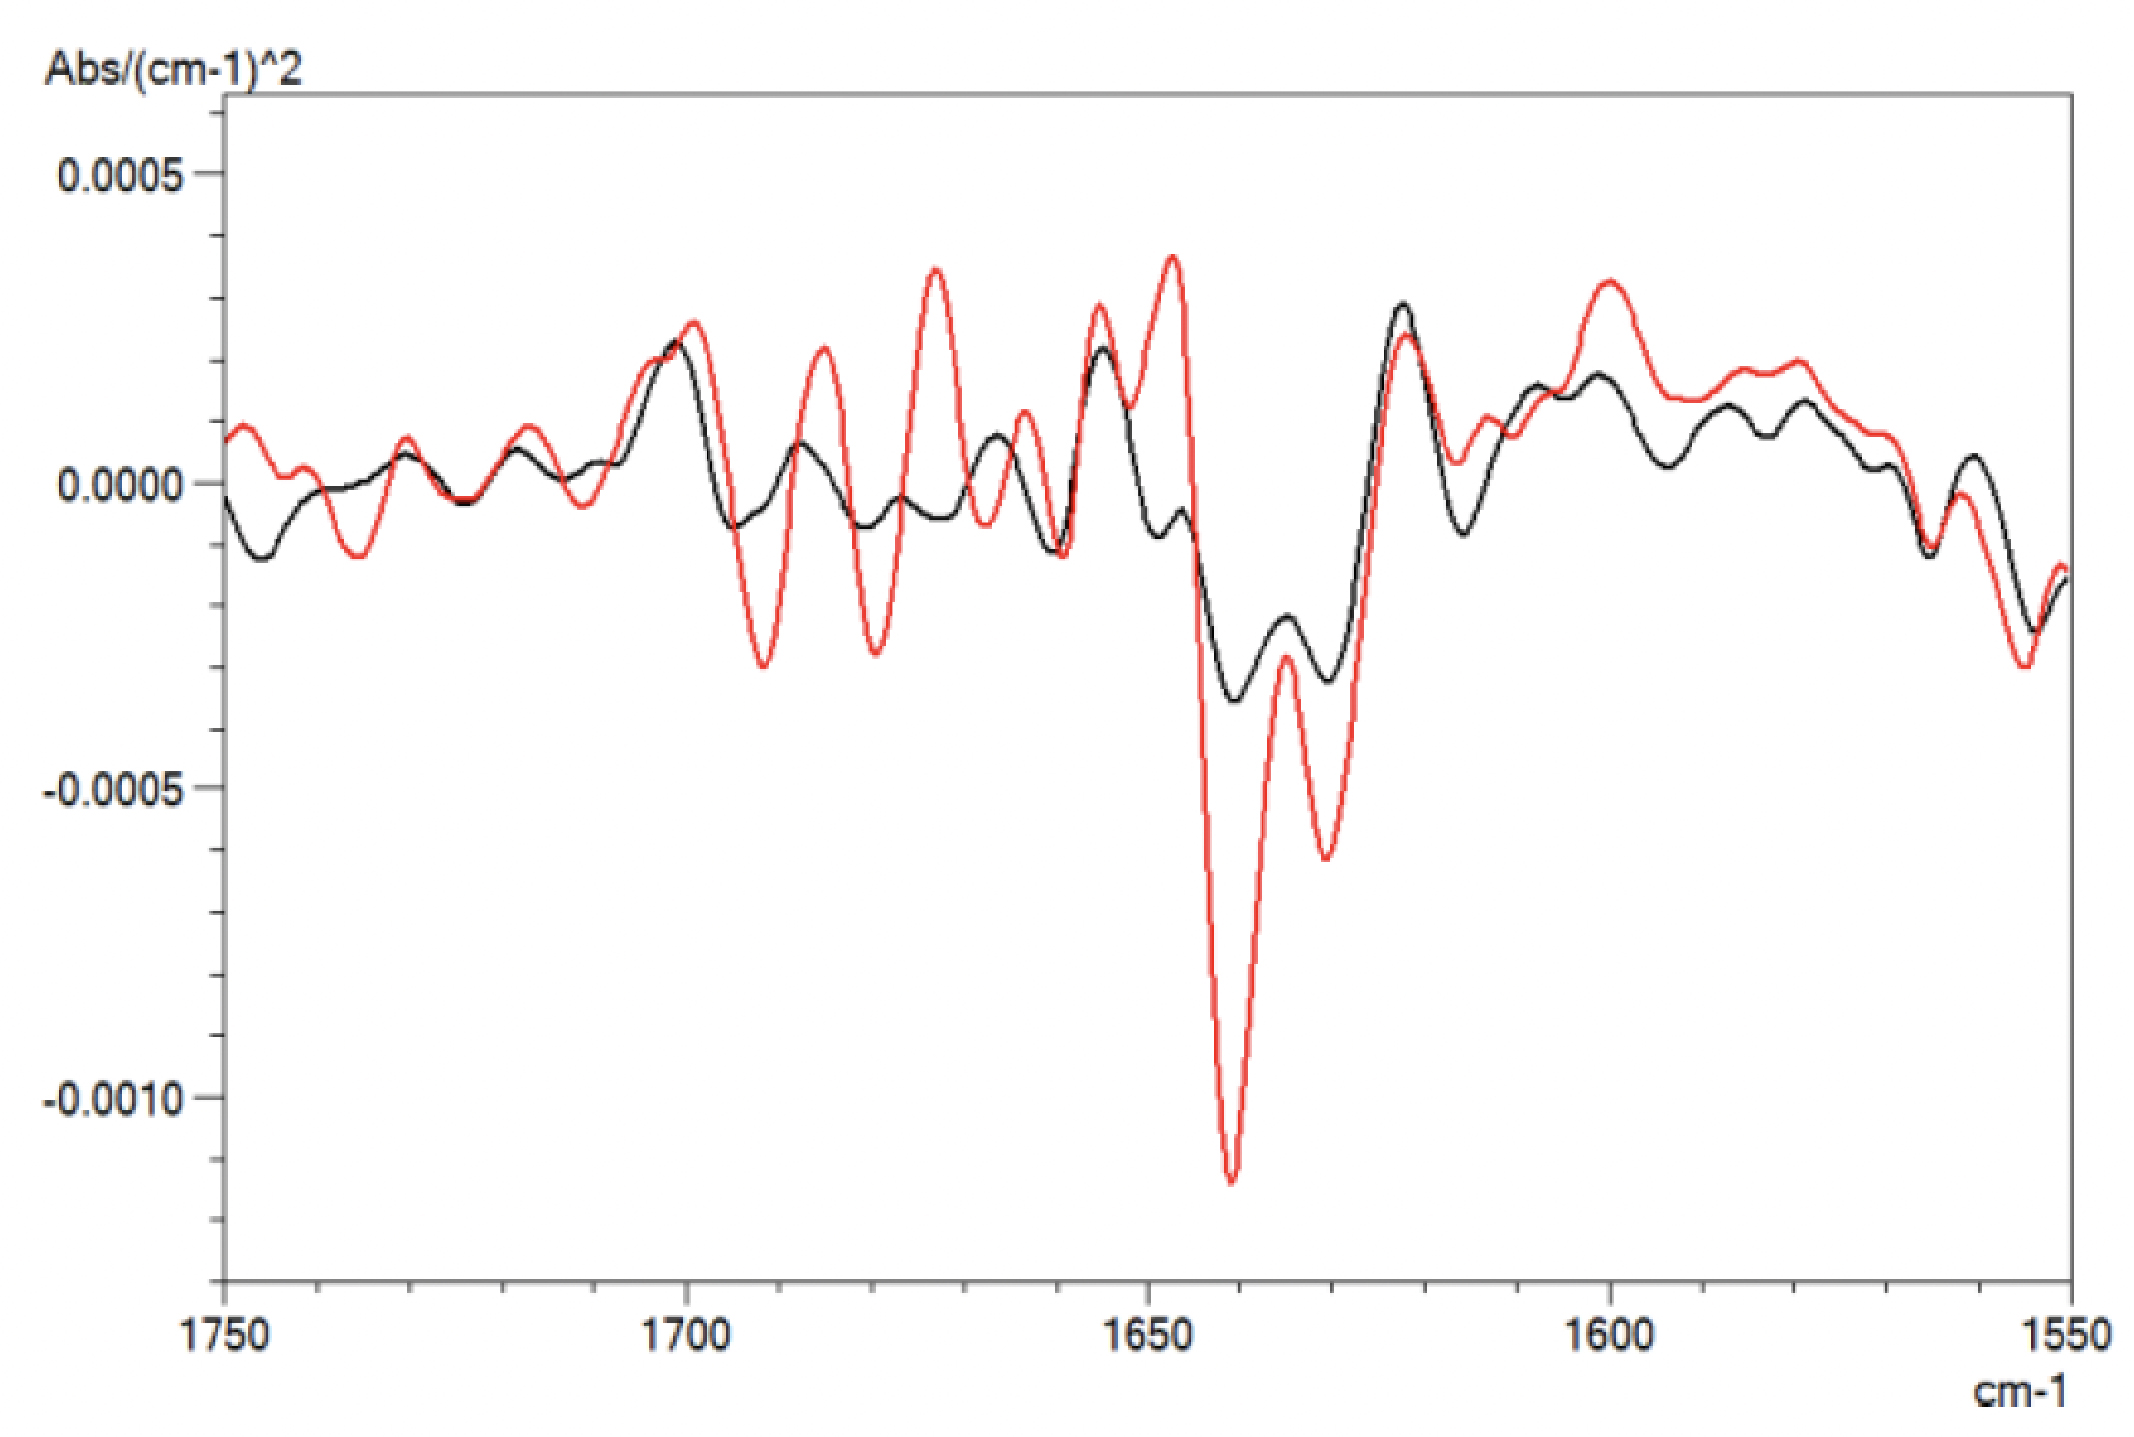
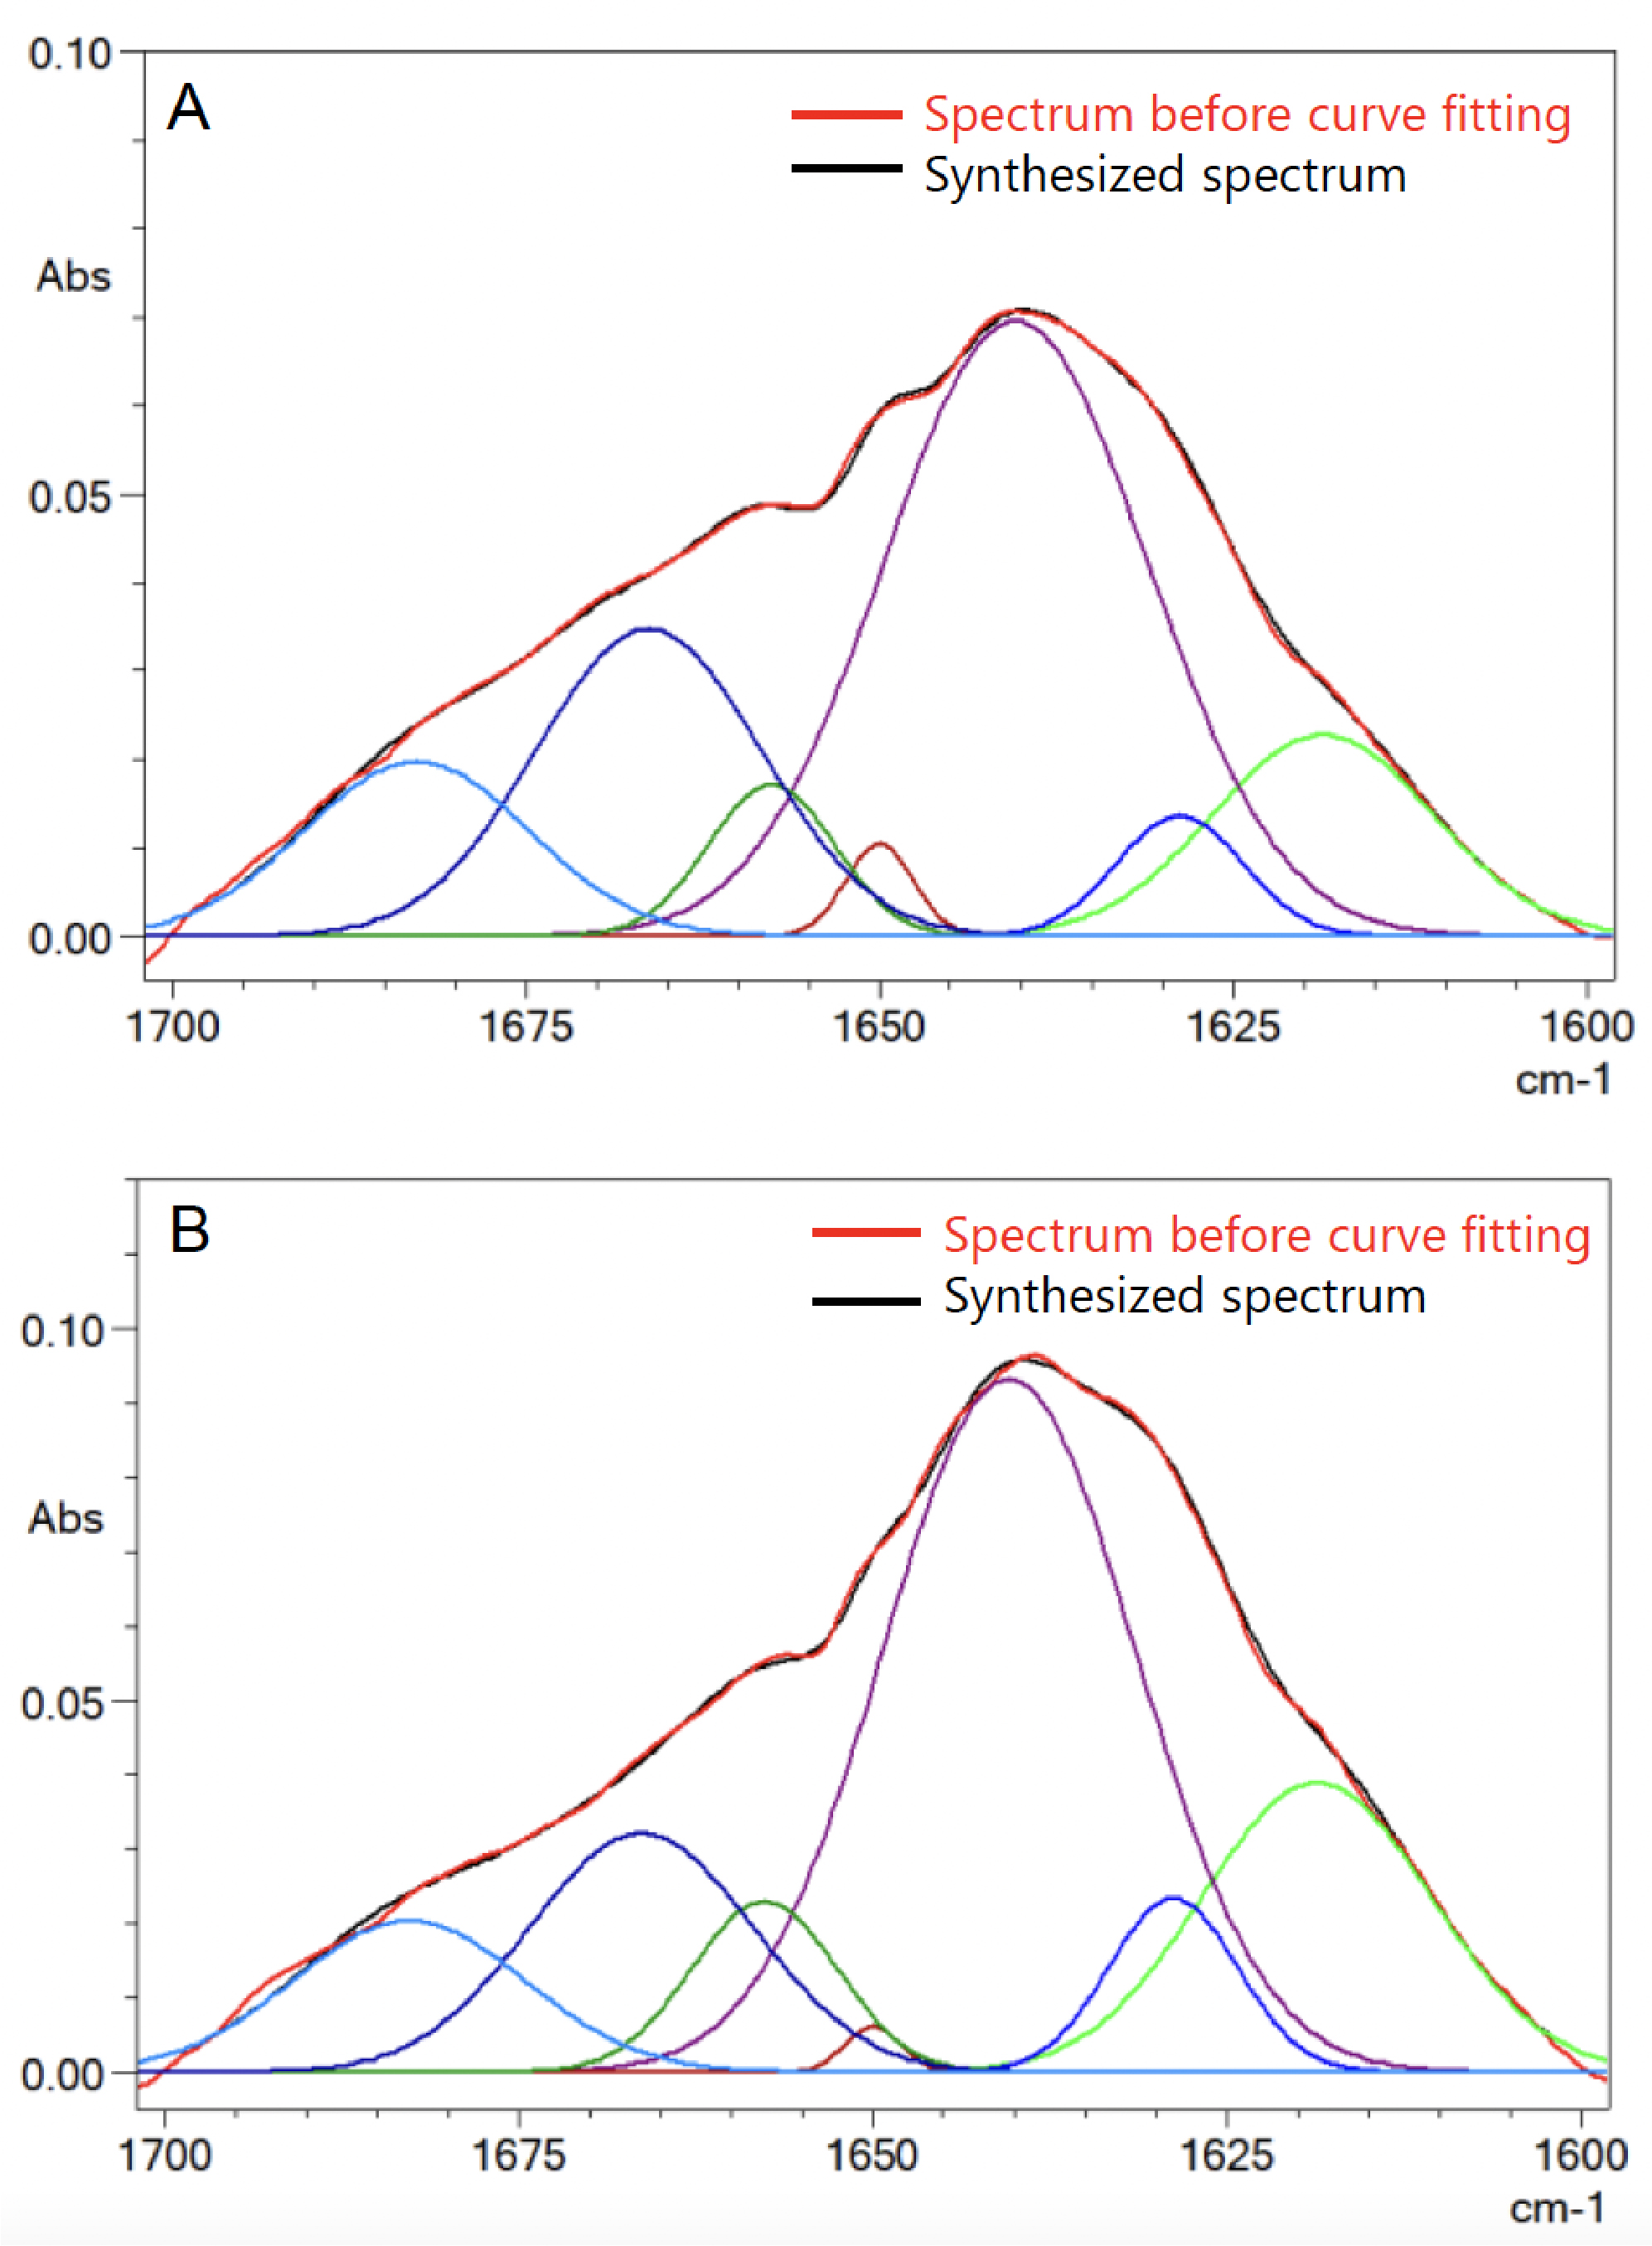
Figure 3 shows the second derivative spectra of antibody protein. The band positions from the second derivative spectra were used as a guide for the curve fitting analysis of amide band I. The subtracted antibody spectra from Figure 2 were ATR corrected to obtain a spectrum similar to a transmission method spectrum. The ATR corrected spectra were further smoothened using a seven-point Savizky-Golay function to remove any possible white noise. This is followed by baseline correction of amide band I. LabSolutionsTM IR Curve-Fitting function was used for band curve-fitting analysis of amide band I based on the setting in Table 2. Figure 4 shows the IR spectra of curve-fitted amide band I for bevacizumab biosimilar (A) and trastuzumab (B).
Table 2 Curve fitting setting
Peak Curve Type: Gaussian Function
Baseline: No Baseline
Range: 1595 - 1705 cm-1
Maximum Error: 0.01%
Each component peak represents a secondary structure element [4]. The relative contribution of each secondary structure element relative to the total contribution is calculated from the area of each assigned component peaks. The quantitation results of each secondary structure element for both bevacizumab biosimilar and trastuzumab are shown in Table 3. The quantitation results are averaged from four repeated measurements.
| Secondary Structure | Bevacizumab Biosimilar (%) | Trastuzumab (%) |
| α-helix | 5.91 | 6.65 |
| β-sheet | 62.31 | 70.08 |
| β-turn | 29.83 | 22.88 |
| Random | 1.94 | 0.39 |
Table 3 Percentage of secondary structure of bevacizumab biosimilar and trastuzumab
Conclusion
The secondary structures of mAbs were analysed using curve fitting method on amide band I region. Using FTIR spectroscopy with a 9 reflection ATR accessory, measurement of protein in aqueous solution can be carried out with minimal sample volume and simple sample preparation steps.
References
- Davies, D. R., and Metzger, H. (1983) Structural Basis of Antibody Function. Annu Rev Immunol 1:87–115.
- Wei, Z., Shacter, E., Schenerman, M., Dougherty, J., and D.McLeod, L. (2011) The Role of Higher-Order Structure in Defining Biopharmaceutical Quality. BioProcess International 5:58–66.
- Lee, Z. H, Kuek, J. S., Lim, J and Chua, A. M. (2018). Determination of Protein Secondary Structures using FTIR Spectroscopy. Application News, No. AD-0178.
- Dong, A., Huang, P. and Caughey, W. S. (1990). Protein secondary structures in water from second-derivative amide I infrared spectra. Biochemistry 29: 3303–3308.